USD/MXN Bullish?We are expecting a pullback to the supply zone that is we are targeting which is 18.08 . The dollar is gaining strength and we don't know wether this is a short term gain or a long term gain but fundamentals will tell us more
USDMXN trade ideas

USDMXNThis Weekly FORECAST
Opportunity for USDMXN. This setup trading idea is for intraday. >> TAYOR
Risk Factors:
1. Market conditions, unexpected news, or external events could impact the trade.
2. Always use risk management strategies to protect your capital.

USDMXN SWING TRADEHow can i say no to this perfect analysis !
look at the beautiful chart
oh my godness ~
lets gooooo !!!!!

Analysis of USD/MXN Monthly ChartAnalyzing the USD/MXN monthly chart, it looks like we're witnessing some interesting developments. The pair has been in a descending channel since early 2020, but it recently broke above the descending trendline. This could signal a shift in momentum.
Key levels to watch:
Support around 16.50 has been rock-solid.
Resistance near 19.50 is crucial if we see continued upward movement.
The RSI is at 37.56, rising but still in bearish territory. A move above 50 could confirm a bullish trend reversal. Also, there's a larger symmetrical triangle pattern in play. If the price stays above the breakout point, we might see further gains towards the upper trendline.
The recent increase in volatility suggests there's strong interest and potential for significant moves. While the long-term trend is bearish, the recent breakout is promising.
Keep an eye on these levels and indicators as we move forward.
Analysis of USD/MXN Monthly Chart
Let's dive into the monthly chart of USD/MXN, which shows some interesting trends and potential trading opportunities.
Descending Trendline and Channel:
The pair has been trading within a descending channel since the peak in early 2020.
Recently, USD/MXN broke above the descending trendline, indicating a potential shift in momentum.
Support and Resistance Levels:
The strong support level around 17.00 has been tested multiple times, holding firm each time.
The resistance zone near 20.00, corresponding to the upper boundary of the previous channel, is a key level to watch.
RSI (Relative Strength Index):
The RSI at 37.56 suggests that the pair is still in bearish territory but has been rising, indicating increasing bullish momentum.
A move above the 50 level on the RSI could confirm a bullish reversal.
Pattern Formation:
There appears to be a larger symmetrical triangle pattern forming, with the recent breakout being a significant move.
If the price holds above the breakout point, we could see further gains towards the upper trendline of the triangle.
Volume and Price Action:
The recent price action shows increased volatility, suggesting heightened interest and potential for further significant moves.
The long-term trend is still bearish, but the recent breakout could be an early sign of trend reversal.

USDMXN finds support The USDMXN is finding some support at the 50% retracement of the April 2024 lows to June 2024 highs at 17.6200. This is also where the 50dma resides as well. In order to complete an AB=CD move we thought the risk may be back towards 17.4800, however a move back above previous support at 17.8700 which is the June 24th lows would suggest we are ready to make a move back towards the 19.00 level.

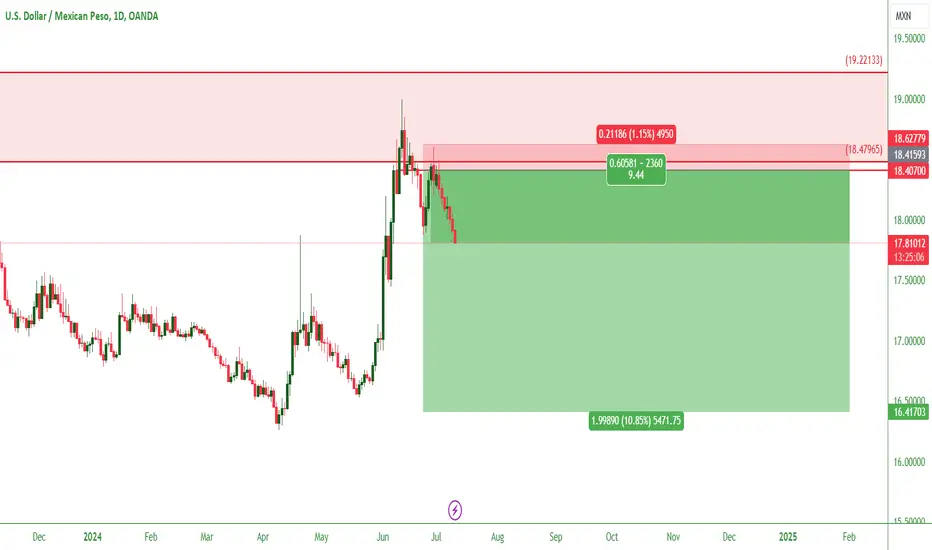
USDMXN Short Analysis - Trade Update Last week, the price of USDMXN rejected the significant psychological level of 19.00. From the COT index, we observed that the pair had been muted for an extended period. However, I saw value in buying MXN leading into July. 🌞
🚨 Trade Update:
The trade is currently running 597 pips in profit! 🎉
Stop Loss: Moved to 18.62 to lock in profits.
Take Profit: Adjusted to 16.41.
This strategy continues to align with the current market dynamics and seasonal trends, making it a compelling opportunity. Let's see how it plays out! 📊
Happy Trading! 🚀
USDMXN nearing previous support Intraday Update: The USDMXN has pivoted off the 50% retracement at 17.63 and is nearing the previous support at 17.88 which should find sellers intraday.

USD/MXN BULLISH?Mexican peso is heading to 18.00 as the the us dollar gains strength after ppi data on Friday

USDMXN LONG SL & TP ON CHARTI believe in the coming few years the peso will go back to $18
Will be consistently looking to long USDMXN
Interest rates of the peso will be reduced, albeit slowly.
I think trump will be back in office which will affect the peso significantly.
Price action wise 16.4 looks like a favourable entry from previous respect of this level on higher timeframe.
0.5%-1% risk

USD/MXN BULLISH?Mexican peso has been appreciating because of the declining dollar ,CPI print tell us that this might be a short term pullback

USD/MXN BULLISH?Mexican peso has been appreciating because of the declining dollar ,CPI print tell us that this might be a short term pullback

Crazy people making crazy claimsRecently news outlets have been reporting in 2 things about the US-Mexico relationship 1st is the super peso. 2nd is the lowering of interest rates in the USA. When looking at the news I saw multiple articles contradicting themselves. Saying things like "the mexican peso got stronger because of the rasing inflation" or as in this one where it says the "the advancment is atributed to the coments of Jerome Powell, which gave hope to rate cuts" as you can see in this one : elmanana.com.mx
Meanwhile you have this one which shows raising inflation in Mexico, which I have to admit it's true, the cost of living in mexico is rising. This means that every day the mexican peso es less able to afford goods or services.
www.msn.com
On the other hand with the united states' recent slight decrease in inflation has prompet the FED to be more inclined to realize a rate cut. This in order to boost the markets before the elections. This is very likely to excite the markets, as money from bonds will likely migrate to the stock market. Contrast this with Mexico where the central bank is claiming to reach it's inflation target by the end of 2025.
www.msn.com
For these people I have some basic economic facts they should be aware of. When you have rasing inflation your currency doen't apreciate it depreciates. Thats because you aren't able to afford buying as much with the same amount. Therefore if the inflation of you currency increases while the inflation on another currency decreases then the most likely outcome is that the decresing inflation currency will apreaciate in contrast to the other one. Aditionally if the US market begins to grow at a faster rate in contrast to the mexican market then the currency will also depreciate. Therefore saysing that the lowering of interest rates in the USA is good for the mexican peso is just insane.


Intraday RSI's oversoldIntraday Update: The USDMXN has broken the 17.88 support as the market closed on this level in North American trade, however, intraday RSI's are oversold and could mark a key low if formed today.

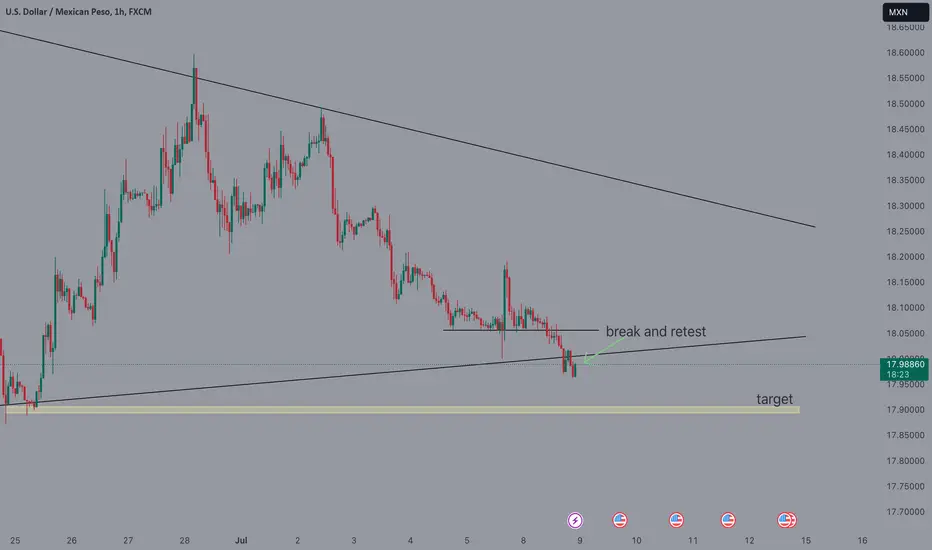
usdmxn short #usdmxnAfter USDMXN broke the triangle downwards, it tested this resistance and made a lower bottom. It will drop to 17.9 levels soon.

USDMXN LongIt is true that DXY is bearish at the moment, but this pair has shown enough sign that it will shoot up.
1- a Morning star formed
2-a hammer formed
3-A bullish engulfing candle
4-trendline broken

USD/MXN Daily AnalysisWe may be seeing a change of cycle on this pair with a potential lower high being formed after price rejected the 61.8% retracement. A break of Fridays low could signal further downside.

look to go bullish Emc Setup on the peso this will be a Swing play so the entry was hit last week fri. so lets see how she wants to act...

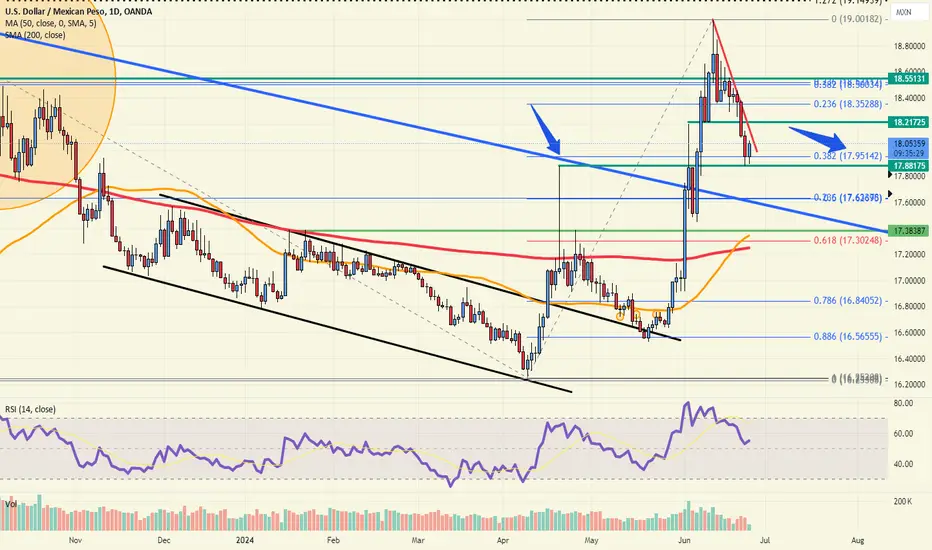
USDMXN Major long-term bullish break-out after 4 years!The USDMXN pair broke above the 4-year Falling Wedge and so far stopped the rise just before it tested the 1W MA200 (orange trend-line). The last time the pair had a similar long-term bullish break-out was on the August 01 11 break-out.
Following a 5-week consolidation, the price then extended the aggressive rise marginally above the 0.618 Fibonacci retracement level. As a result, we expect another strong bullish wave soon, and our Target is 21.6500 (exactly on the 0.618 Fib).
-------------------------------------------------------------------------------
** Please LIKE 👍, FOLLOW ✅, SHARE 🙌 and COMMENT ✍ if you enjoy this idea! Also share your ideas and charts in the comments section below! This is best way to keep it relevant, support us, keep the content here free and allow the idea to reach as many people as possible. **
-------------------------------------------------------------------------------
💸💸💸💸💸💸
👇 👇 👇 👇 👇 👇

USDMXN found supportIntraday Update: The USDMXN has found support near the 38% retracement and also the spike high from April near 17.90. Dips in the USDMXN may find buyers now below the 18.00 level intraday.
USDMXN Short AnalysisLast week, the price of USDMXN rejected the significant psychological level of 19.00. From the COT index, we can observe that the pair has been muted for an extended period. However, I see value in buying MXN leading into July. 🌞
🔍 Analysis:
I expect the price to trade down to 16.50 before more consolidation.
There is a large imbalance at 17.13.
The previous swing high has been taken, indicating that buy stops have been taken. We can now expect a move downwards, aligning with seasonality patterns. 📅
📉 Trading Plan:
I'm waiting for the price to come back to 18.40 to enter a sell position.
Entry: 18.40
Stop Loss: Above the last swing high at 19.05
Targets: 17.50, 17.00, and 16.50 🎯
This strategy aligns with the current market dynamics and seasonal trends, making it a compelling opportunity. Let's see how it plays out! 📊
Happy Trading! 🚀
#USDMXN #Forex #TradingStrategy #TechnicalAnalysis #MXN

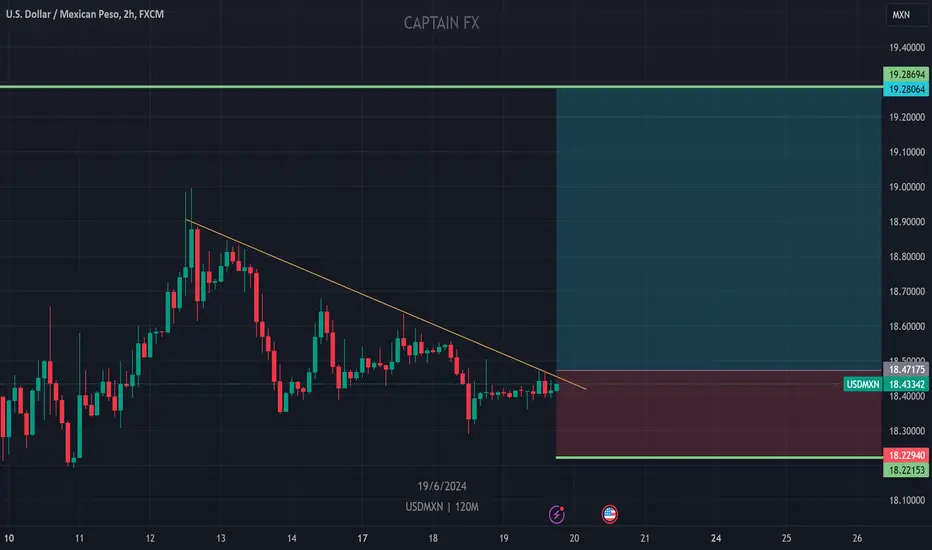
USDMXN BUY-STOP ORDER!!!!!!!!!!!USDMXN have been moving on a falling wedge am expecting a breakouts from this current buy side liquidity and a retest to keep the price stable till target is completed
BUY-STOP ORDER 18.47175
JOIN AND ENJOY
Tell us your views