PC trade ideas

TOP WAVE STRUCTURE I AM BEAHISH NOW REACHED TARGET 4129/4131I am now net SHORT at 75 % into 4129 look for a sharp drop of min 3.8 to 6.2 %


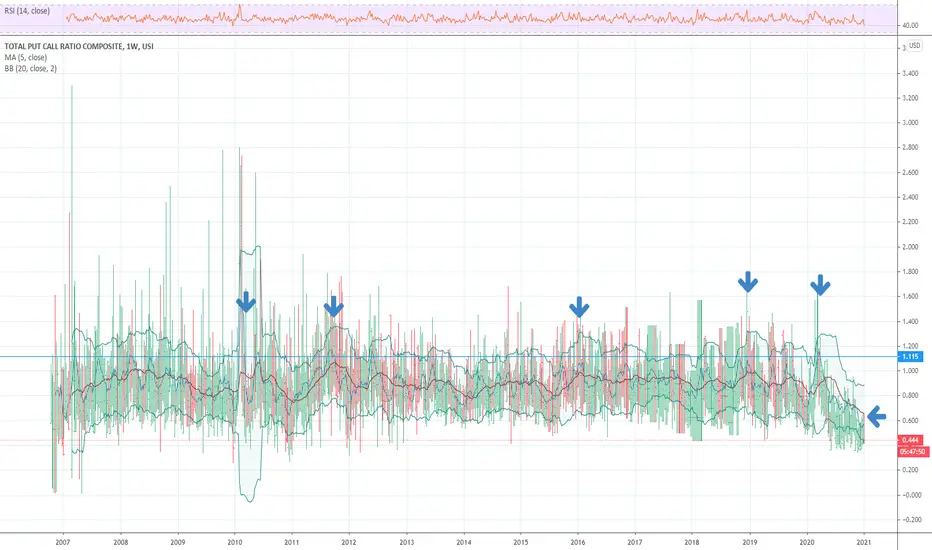
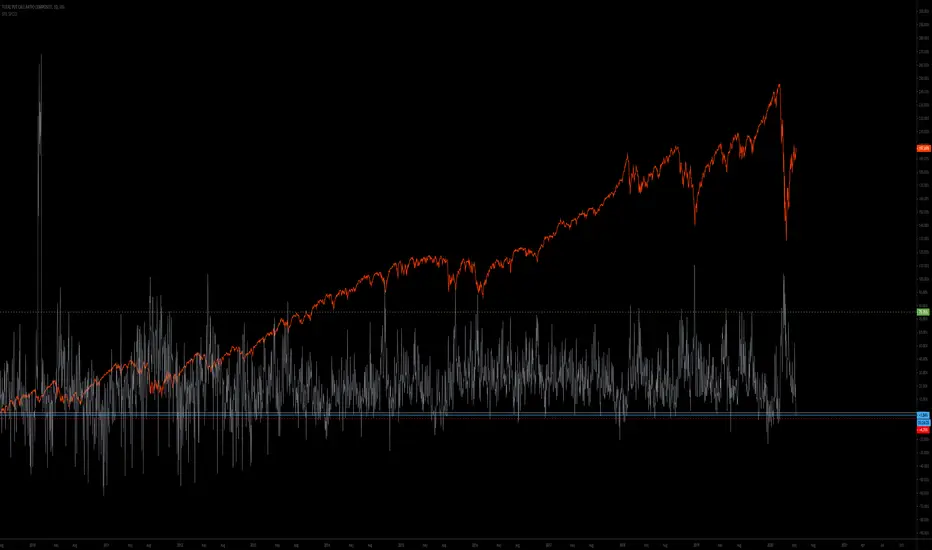
PUT/CALL SETUP MAJOR DECLINE Chart posted is that of the weekly put/call based on 5 ,10,20 week near and record call buying .I maintain a full short from 3744 and will add today at 3824 I am long US $ NOW BEARISH GOLD AND SHORT ALL BANKS NOW

SPX Putt/Call Ratio composite reading not clear ???not confirming a bottom. below .6 not reliable.
wish you all the best

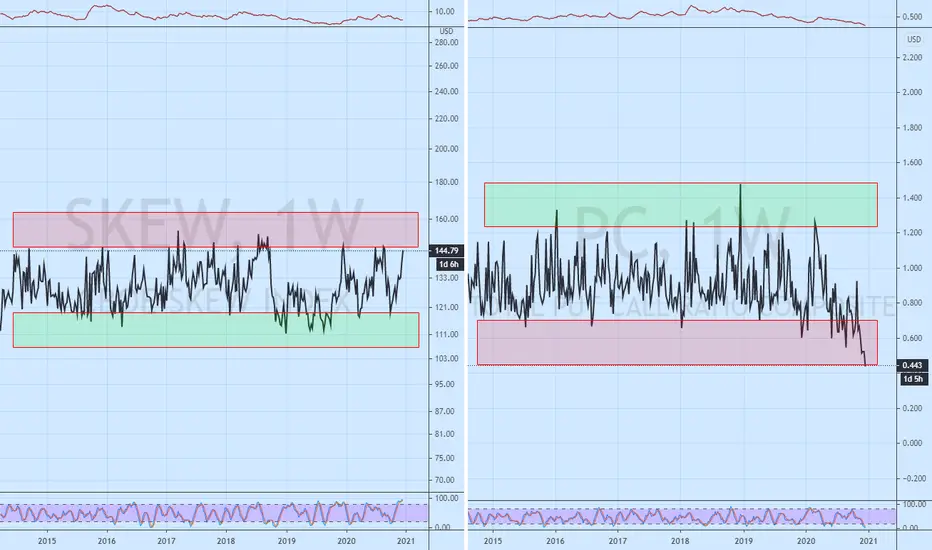
Put/Call and SKEW in red zonesJust and FYI that we are at the bullish extremes on both the P/C and the SKEW. So we have reversion to the mean risk right now.
CALL BUYING AT ALLTIME RECORD IN 5 WK AVG BULL MARKET RISK CHART POSTED IS A CLEAR WARNING TO BE RESPECTED SEE TOPS 1973 2000 2007


SPX put/call ratio just broke 200 MAIn the past tow years was quite successful indicting the pullbacks are in progress except ONE time when it was lagging.
wish all safe trading.

too many bullsI love me a good BTFD but there are 2 calls for every put rn and the economic data is not there yet. We are overdue for some pullback.

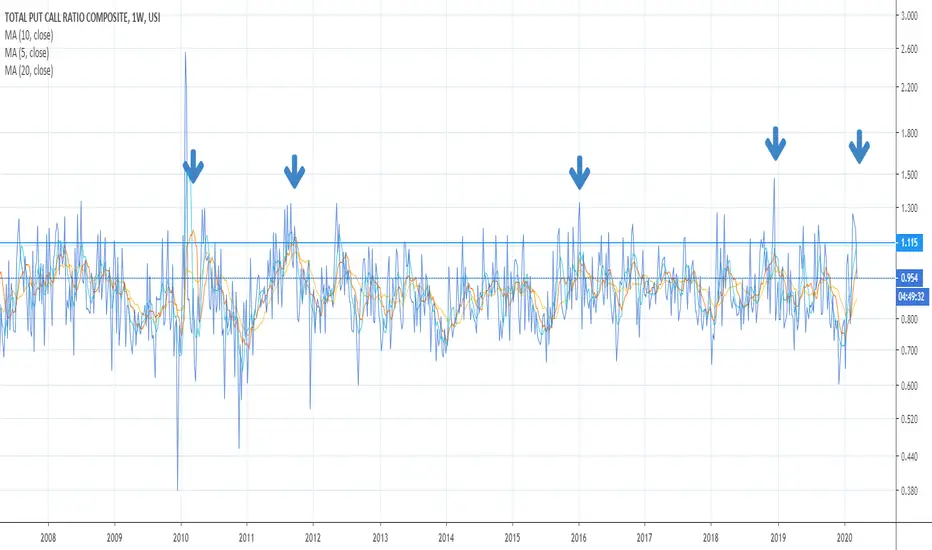
The Put to Call Ratio Is Screaming: "Top" (Again)Just a few numbers for you. The green vertical lines are the two lows on the 50-day moving average. On February 21, that average printed 0.752. Today it printed the lowest day since that day, 0.744.
Today's actual , not-averaged number, was 0.583, the lowest day since June 8th, which was our last big pullback.
So, we have four numbers and three tops: February and June each showed their own signs, and now we are showing each of those two signs.
In the spirit of the dangers faced by Corporal Hicks and his companions, I will quote him: "Stay frosty."

P/C ratio suggests next crash wave imminentThe P/C ratio hit absolute extremes which historically suggest a market top a few days ago and the overall structure over the past two weeks resembles the Feb 2020 top to the day. With the QQQ overload, I can see clearly that the tsunami mays just around the corner, exactly as an important resistance line is about to break and everyone about to jump on the bull train.
What Put:Call Ratio Tells Us About SPY QQQHere is a chart of the put to call ratio when compared with NASDAQ's ETF, QQQ. When the line is at the bottom of the PC chart, that means market participants are net short. When at the top, they are net long.
I'm sure we've all heard the saying that market makers usually take the other side of the trade. This chart shows that this is a true.
When stocks are going up, the majority of retail traders are shorting the market. When the market goes down, the majority of retail traders are longing the market.
Right now we're in an extreme situation where the majority of retail traders are shorting the market and institutions are doing what they do best, hitting their stop losses and squeezing them out, essentially taking the free money on the table. When this is no longer profitable, the trend usually changes with a few exceptions (see March 2020). To look at it another way, institutions make money on retail trader's emotions which is specifically disbelief.
They say 90% of retail traders lose money trading the stock market. I believe this chart is evidence of that.

SPY Institutions Taking The Other Side of Your TradeThis is a chart of the put to call ratio. The market is currently near an extreme of sellers to buyers indicating there will likely be a shift soon. If everyone is shorting the market, institutions are buying to stop out the shorts. They'll continue to do this until this strategy doesn't work anymore. Once sellers capitulate, they'll change their strategy to capitulate the bulls. They purchase data from brokers that show them where everyone's stop losses are and this is well documented. They see your stop loss, and their goal is to get it.
MORE PAIN VERY SOON WAY TOO MANY CALL BUYING No seem to learn Rinse and repeat so traders traders I covered my short but I will be moving back into a 75 % net short if the can pull off one last gasp from 2712 to 2739 .BUT WE MAD HAVE ALREADY FINISHED THE ABC RALLY .I still see a lot more pain next cycle low is any where from april 23 to may 10 we will see a retest at a .786 or a new low by this dates . the data of bullish view is wrong so wrong based on unemployment coming out in may it will be at or above 11.7 to 14.8 min and this is not just us I see a WAR COMING OR THE THREAT IN THE NEWS SOON WITH CHINA

5 10 20 WK P/C NEARING A LONG TERM BUY The chart posted is one of my best tools we are close to the I.T. and LONG TERM BUY
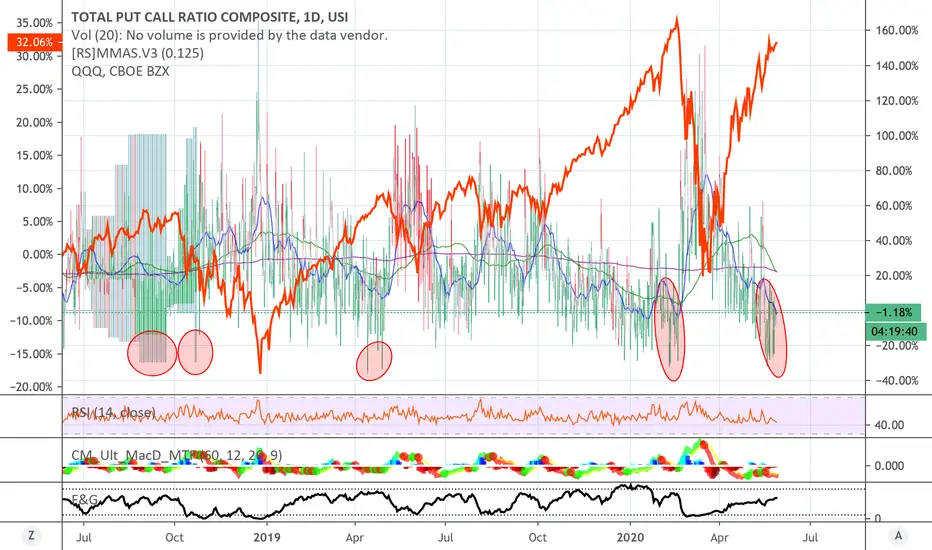
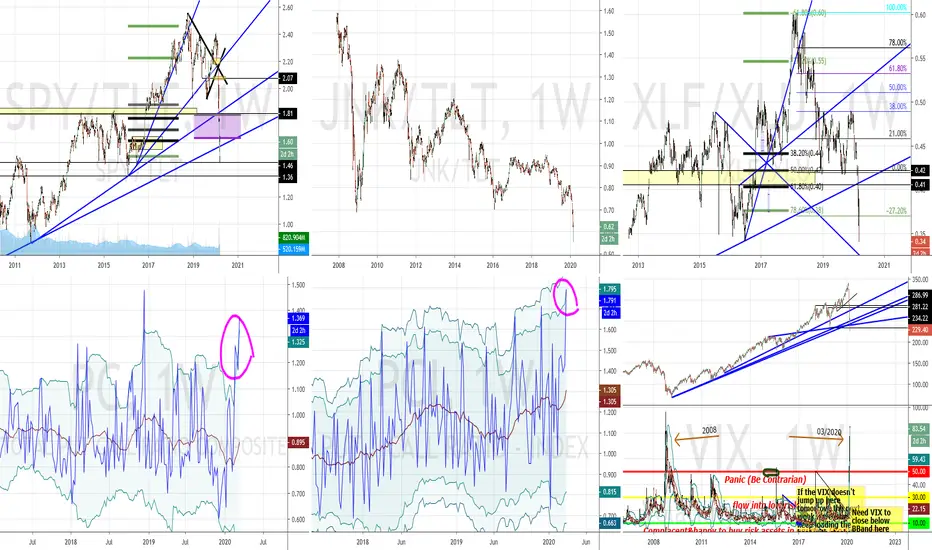
Put-Call Ratio Composite, its Index & the Vix & 2008 LevelsThe Put Call Ration and the Put Call Composite finally match. Also, the VIX is at its highest point since the 2008 financial crisis. Something to watch....
NO PUT CALL BUY SIGNAL YET BASED ON THE 10 AND 20 WK MORE PAINTHE 10 AND 20 WEEK PUT CALL IS A TOOL IN MY MODEL TO BE ON THE RIGHT SIDE FOR A GOOD TREND TRADE WE STILL HAVE NO TRIN BUY SIGNAL AS WELL DO NOT LOOK TO TO BUY ANYTHING YET I STILL HAVE THE 5 TO 7 SPIRALS DUE 3/16 TO 3/21 AND I DO NOT FEEL THAT WE HAVE 5 WAVE DOWN I STILL THING THE SP SEES 2662 TO 2627 AND IWM 121 TO AS LOW AS 108 WAIT TILL ALL THINGS COME IN . THIS WILL BE WAVE A DOWN IN A LONG TERM BEAR .WE WILL HAVE A VERY VERY SHARP RALLY AND IT WILL BE VERY FAST OVER A 3 TO 5 WEEK RUN LIKE 2001 AND A FEW OTHER YEAR I WILL POST IN GREAT DETAIL LATER .BEST OF TRADES .WAVETIMER

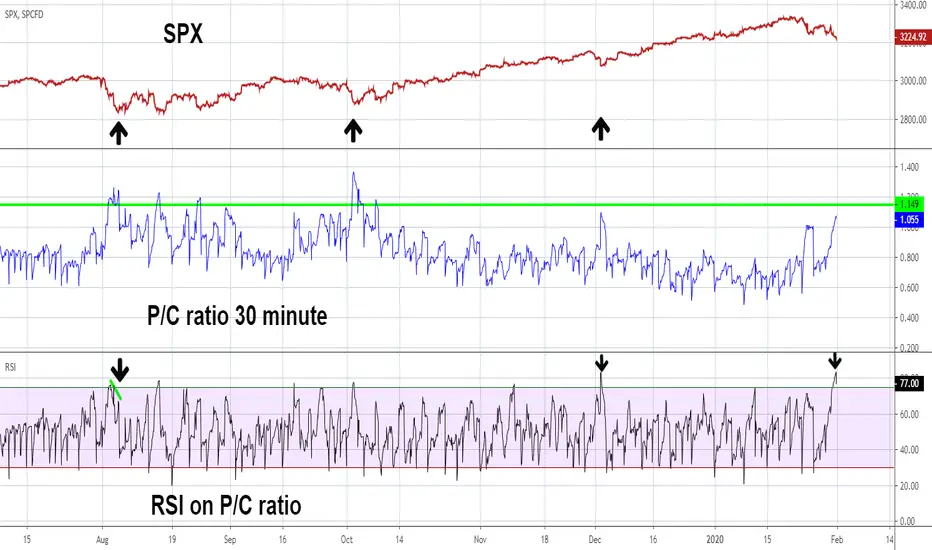
Watch 30 Minute PC Ratio for Possible Buy SignalMy previous post noted the SPX has over the last several months a very reliable 42 trading day cycle of bottoms. The next cycle bottom is due on 2/4/20. Periodic cycles can have leeway, in this case a leeway of two trading days is acceptable, so its possible an SPX bottom could be in place on 1/31/20. If not, watch the 30 minute P/C ratio - chart symbol PC.
Investors Business Daily uses the PC level of 1.15 as an alert for possible bottoms. The two largest SPX corrections on the chart illustrate that when PC goes above 1.15 bottoms can form.
On 1/31/20 the RSI on the PC Ratio hit its highest level since the tiny 12/3/19 bottom which is evidence that an SPX bottom could already be in place. However the PC ratio could continue to rise above 1.15 with the RSI diverging against the high it made on 1/31/20.
Be on alert February 3rd to the 6th, if the SPX goes below its low made on 1/31/20 with a PC ratio above 1.15 it could be a fantastic opportunity to go long stocks.
Mark