USOIL:Sharing of the Latest Trading StrategyThis week’s trading wrapped up successfully. Our exclusive VIP trading signals achieved a 90% accuracy rate!👉👉👉
This week, crude oil prices have consecutively closed with bearish candles and declined. On the 4-hour chart, there are four consecutive bearish candles exerting pressure. On Saturday, the OPEC+ convened a meeting ahead of schedule and confirmed the decision to increase production by 411,000 barrels per day in June, which further intensifies the market's concerns about oversupply. It is recommended that for crude oil trading next Monday, short positions should be mainly taken at the resistance level during rebounds.
Trading Strategy:
sell@59.5-58.5
TP:57-55
The signals in the Signature have brought about continuous profits, and accurate signals are shared every day. Hurry up and click to get them!
👇 👇 👇 Obtain signals👉👉👉
USOIL.F trade ideas

Oil Analysis: WTI Approaches the $60 Level AgainOver the past two trading sessions, oil has gained more than 4.5%, and is once again approaching the psychological barrier of $60 per barrel. This recent bullish movement persists despite OPEC+’s clear stance on increasing supply in June and the International Energy Agency’s (IEA) cautious outlook on global oil demand for the remainder of the year. As such, it appears that oil prices are currently benefiting from improving market sentiment, particularly as investors await the outcome of the upcoming U.S.–China trade negotiations.
Persistent Bearish Trend
Since mid-January, oil has maintained a steady downtrend, and so far, minor bullish retracements have not been strong enough to signal a meaningful reversal. Therefore, this downward technical formation remains the dominant structure to monitor in upcoming trading sessions.
RSI
The Relative Strength Index (RSI) continues to hover around the 50 level, indicating a sustained balance between bullish and bearish momentum. As long as this equilibrium remains, a neutral bias could dominate short-term price movements.
ADX
The Average Directional Index (ADX) remains close to the 40 mark, though the line has recently begun to flatten. This could be interpreted as a sign of weakening trend strength in the short term, likely due to the price currently testing a significant resistance zone.
Key Levels to Watch:
$60 – Nearby resistance: A short-term psychological level. A break above this zone could reactivate a bullish bias and potentially lead to the formation of a new short-term uptrend.
$63 – Main resistance: Aligned with the 50-period moving average. Sustained price action above this level could challenge the prevailing long-term bearish structure.
$57 – Nearby support: A zone that matches recent multi-week lows. A drop below this level could reinforce bearish momentum and provide more room for the current downtrend to extend.
Written by Julian Pineda, CFA – Market Analyst

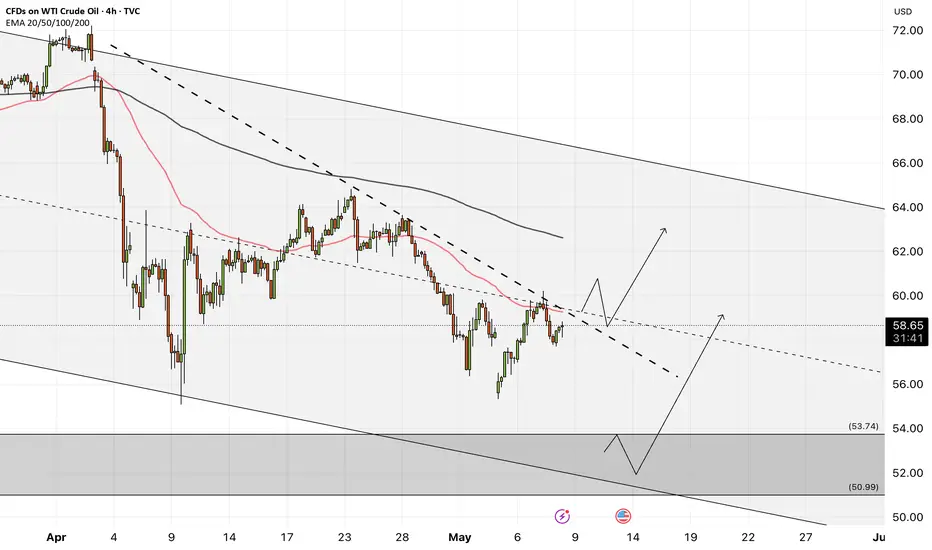
WTI - Will Oil Return to the Uptrend?!WTI oil is below the EMA200 and EMA50 on the 4-hour timeframe and is moving within its medium-term descending channel. If the downward trend continues towards the zone, the next opportunity to buy oil at a good price will be presented to us. A break of the drawn downtrend line will also be another confirmation to enter the oil buying process.
Goldman Sachs anticipates that the Federal Open Market Committee will maintain its pause on interest rate hikes. According to the bank’s asset management division, the continued strength of the labor market remains a crucial factor influencing the Federal Reserve’s decisions, prompting the central bank to adopt a cautious stance.
In a recent note, Goldman Sachs stated: “The Federal Reserve is currently in a holding pattern, waiting for economic uncertainties to diminish.” Although recent employment data have exceeded expectations, the bank believes that initiating a rate-cutting cycle would require clear signs of labor market weakening—a development that could take several months to materialize. The note further stated: “Since the labor market has yet to exhibit any significant softening, the likelihood of another hold decision in the next meeting is high.”
Meanwhile, U.S. President Donald Trump, ahead of his upcoming trip to Saudi Arabia, Qatar, and the United Arab Emirates, responded to a question about the potential renaming of the “Persian Gulf” to the “Arabian Gulf” in official U.S. documents. He stated that a decision would be made following his trip and a related discussion.
Trump acknowledged the sensitivities surrounding the issue, saying he does not wish to offend anyone. He also referenced his prior executive order to rename the “Gulf of Mexico” as the “Gulf of America,” which he described as a necessary move. He concluded by noting that a final decision regarding the name of the Persian Gulf would be made after the scheduled discussions.Additionally, the RIA Novosti news agency reported on Thursday that Chinese President Xi Jinping and Russian President Vladimir Putin had officially begun talks at the Kremlin. Prior to the discussions, Putin expressed his intention to engage with President Xi on “a broad range of bilateral relations,” emphasizing that the Russia-China partnership is mutually beneficial. He also expressed his willingness to visit Beijing for a celebration marking China’s victory over Japan.
According to the report, the two leaders are expected to issue joint statements and address the media following their talks. A correspondent from the TASS news agency reported that the agenda for the Xi-Putin discussions is likely to include bilateral cooperation in various sectors, such as energy, the conflict in Ukraine, and the development of the “Power of Siberia 2” gas pipeline project.
OILOil is losing its short-term trend line, and if this happens, it will have a cell and sell until the next trendline.

Energy is life: tailwind for the global economy?Oil prices in gold in a clear down trend, presumably on the back of increased shale production and greater renewables, and resurgence of nuclear. Unless demand accelerates (AI? middle class growth in India?), this is very supportive of economic growth.

NEXT MOVE The price has already tested the support-turned-resistance zone (around $61.30–$61.50) and showed early signs of rejection with high selling volume.
This suggests buyers may be losing momentum near this level.

Oil on high time frame
"Regarding WTI oil, the price trend on high time frames is bearish, especially on the daily chart. After completing its pullback on the 4-hour chart, there are indications of further downside potential.
The market's volatility may be influenced by geopolitical tensions and political factors between Iran and the USA, as well as tariff issues. Despite these fluctuations, candle formations suggest the potential for prices to drop towards the $58 zone."
If you require more assistance or have any specific questions, feel free to ask!

USOIL BEARISH BIAS RIGHT NOW| SHORT
USOIL SIGNAL
Trade Direction: short
Entry Level: 63.13
Target Level: 61.78
Stop Loss: 64.03
RISK PROFILE
Risk level: medium
Suggested risk: 1%
Timeframe: 1h
Disclosure: I am part of Trade Nation's Influencer program and receive a monthly fee for using their TradingView charts in my analysis.
✅LIKE AND COMMENT MY IDEAS✅

USOIL ABOUT TO SELL MASSIVELY Price has dropped over 1.59% today! It currently trade at $61.01 per barrel. A sell opportunity is envisaged once price drops lower to $59.9 our target profit is $56

Crude Oil's Bearish Trend Continues: Intraday Trading StrategiesDuring the US trading session on Monday, crude oil recovered part of the losses from the sharp decline at the opening of this week. Previously, OPEC+ unexpectedly increased production again, causing crude oil to continue the bearish trend that has been gradually taking shape since March.
Today, the price of crude oil first rose and then fell. After hitting a new low, the upward trend continued, but when it reached around $57.7, it encountered significant resistance. Looking ahead, it is expected that crude oil will experience an oscillation phase first, and then continue its downward trend.
Currently, crude oil is still in a bear - dominated trend. For intraday trading strategies, it is recommended to focus on short - selling on rallies and use buying on dips as a secondary approach. Pay close attention to the resistance range of $57.7 - $58.5 on the upside and the support range of $55.5 - $54.0 on the downside.
USOIL
sell@57.30-57.50
tp:56.50-56.00
Investment itself is not risky; it is only when investment is out of control that risks occur. When trading, always remember not to act on impulse. I will share trading signals every day. All the signals have been accurate without any mistakes for a whole month. No matter what gains or losses you've had in the past, with my help, you have the hope of achieving a breakthrough in your investment.

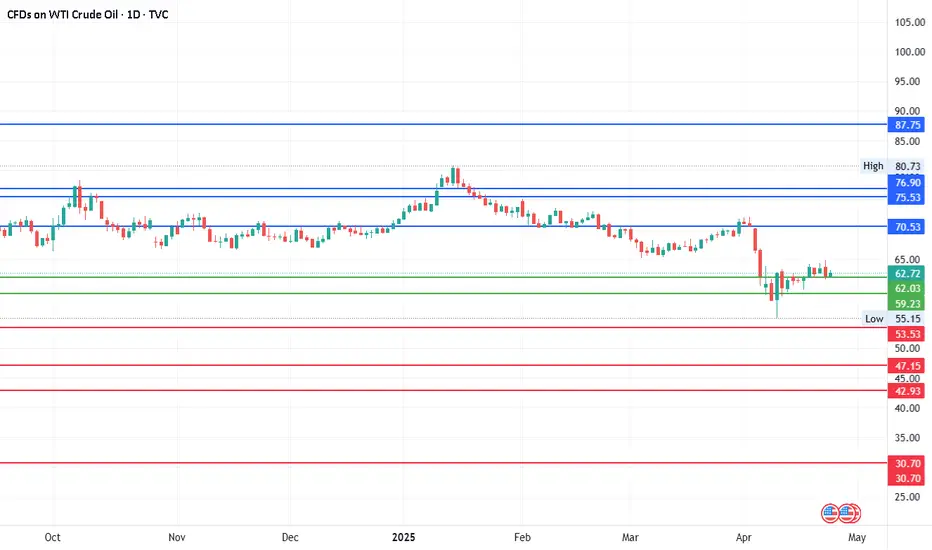
Crude oilCurrent Price: 62.60
Mid-Point Range: 59.23 to 62.03
Upside Targets: 70.53, 75.53, 76.90 and 87.75 (Between 75.53 & 76.90 could be next
Posible range to be in a consolidation mode.
Downside Targets: 53.53, 47.15, 42.93, 30.70
USOIL:Strategic Analysis on ThursdayThe Ministry of Energy of Kazakhstan stated that the country has no plans to cut oil production in May. The country has continuously exceeded production limits, creating tensions within OPEC+. The Ministry of Energy in Astana said that the largest oil-producing country in Central Asia will have an average daily production of crude oil and condensate of 277,000 tons in May, remaining the same as in April, while the average daily production in March was 260,000 tons. OPEC+ has agreed to significantly increase production for two consecutive months, surprising traders and pushing down oil prices. This move is largely driven by Saudi Arabia, the leader of OPEC, which hopes to punish member states such as Kazakhstan that have continuously exceeded production limits. Crude oil has shown a trend of stabilizing and rebounding at a low level today, stabilizing and rising around $57.7, and showing a volatile upward trend. The key today is whether the upward trend of crude oil can continue to break above the level of $60.6.
you are currently struggling with losses, or are unsure which of the numerous trading strategies to follow, at this moment, you can choose to observe the operations within our channel.

USOIL:Sharing of the Latest Trading StrategyAll the trading signals today have resulted in profits!!! Check it!!!👉👉👉
Due to the expectation that the China-US trade war has peaked, the oil price is expected to continue its rebound momentum and break through the level of $60 per barrel. However, the uncertainties of trade negotiations and the supply potential of Iran pose a dual pressure. In the short term, the fluctuations of the oil price will be more dominated by geopolitical factors and inventory dynamics. In terms of trading strategies, it is recommended to mainly go short on rebounds. In the short term, pay attention to the resistance at 61.0 above, and the support at 58.0 below.
Trading Strategy:
sell@61-60
TP:58.5-58
The signals in the Signature have brought about continuous profits, and accurate signals are shared every day. Hurry up and click to get them!
👇 👇 👇 Obtain signals👉👉👉

Oil to soon hit below $50.0Please ignore that Asia BOX. Besides that oil is coming further down. but trying to fine tune my entry and exit setup. For me this would be a nice good grade setup cuz of L mapping. I think its got more downside to fall. Hope its not too greedy to set that huge of TP but you never know with commodities and expectations run outside of the reality as bigger the TF more inaccurate you shall be.

USOIL Today's strategyFrom a technical perspective, if USOIL can take advantage of the weakening of the DXY, stabilize and rebound near the current price, and break through the key resistance level, it may be able to form an upward trend. However, if it fails to effectively withstand the impact of the production increase by OPEC+, and breaks below the key support level, the price is likely to decline further.
Currently, it is necessary to closely monitor the competition around the price level of $55. If this level can be held, the probability of a rebound will increase. Once it is broken, the next support level may be around the $53 area. At the same time, continuously tracking the trend of the DXY and the subsequent policy dynamics of OPEC+ is of vital importance for judging the future trend of USOIL.
USOIL
buy@55-56
tp:57.5-58.5
I am committed to sharing trading signals every day. Among them, real-time signals will be flexibly pushed according to market dynamics. All the signals sent out last week accurately matched the market trends, helping numerous traders achieve substantial profits. Regardless of your previous investment performance, I believe that with the support of my professional strategies and timely signals, I will surely be able to assist you in breaking through investment bottlenecks and achieving new breakthroughs in the trading field.


Analysis of the Market Trend for Next WeekThe price of crude oil futures declined on Friday, falling by approximately 1% during the session, giving back the gains brought about by a brief technical rebound. Bearish demand signals continued to dominate traders' sentiment. The price of crude oil is likely to drop by more than 7% this week, which reflects the growing concerns in the market about the weakening of global demand. Traders remain cautious ahead of the crucial OPEC+ meeting scheduled for May 5th. It is expected that some member states will push for an acceleration of production increases before June. There are reports that Saudi Arabia has hinted that it has no intention of supporting oil prices through a new round of production cuts, which has further intensified the downward pressure on oil prices.
In terms of demand, the market remains skeptical about potential trade negotiations. The Ministry of Commerce of China stated that it is evaluating the proposal put forward by the United States to resume tariff negotiations. Analysts said that the trade environment remains unstable and fraught with uncertainties.
Crude oil showed a trend of rising first and then falling today. At the same time, the oil price correction broke below the support line, and the bearish trend of oil prices is expected to enter a further acceleration stage. After the rise first and then the fall, the demarcation line between the bulls and bears of oil prices is around $59.3. If it is under pressure again, it will indicate the continuation of the future trend.

USOILCurrent USOIL Price Drop (May 2025)
WTI crude oil (USOIL) has declined sharply in early May 2025, Key drivers include:
OPEC+ Surprise Supply Increase: OPEC+ announced plans to raise output in June, reversing earlier production cuts and flooding the market with additional barrels.
Tariff-Driven Demand Fears: U.S.-China trade tensions and retaliatory tariffs threaten global economic growth, reducing oil demand forecasts.
Dollar Strength: The U.S. dollar (DXY) has rebounded due to delayed Fed rate cuts and safe-haven demand, pressuring dollar-denominated oil prices.
EIA/Goldman Sachs Forecasts: The U.S. Energy Information Administration (EIA) and Goldman Sachs revised 2025–2026 oil price forecasts downward, citing oversupply risks and weaker demand.
Shifting Dollar-Oil Correlation
Historically, oil and the dollar were inversely correlated (strong dollar = lower oil prices). However, this relationship is weakening due to:
U.S. as a Net Oil Exporter: The U.S. is now the world’s largest crude producer. Higher oil prices improve the U.S. trade balance (vs. worsening it when the U.S. was a net importer).
Petrodollar Dynamics: As the U.S. exports more oil, revenue from oil sales strengthens the dollar, creating a positive correlation in certain scenarios.
Geopolitical and Policy Shocks: Tariffs, OPEC+ decisions, and Fed policy now dominate price action, overshadowing traditional correlations.
Future Directional Bias
Bearish Factors
OPEC+ Supply Surge: Increased production (post-June 2025) could push prices toward $50–$55/barrel (Goldman Sachs base case).
Recession Risks: Weak demand from China/Europe and U.S. tariff impacts may trigger a global slowdown, further depressing oil prices.
Dollar Strength: Fed rate cuts delayed until July 2025 or later could sustain dollar strength, capping oil’s upside.
Bullish Catalysts
Supply Disruptions: Escalating Middle East tensions or OPEC+ policy reversals could tighten supply.
Weaker Dollar: If the Fed signals rate cuts or tariffs ease, dollar weakness could lift oil prices.
Outlook:
USOIL faces downside risks in the near term due to oversupply and demand concern
Exogenous Shocks: Exogenous shocks to the U.S. real interest rate can cause a modest and short-lived decline in the real price of oil. Although there is a higher opportunity cost of holding inventories, oil inventories may increase, reflecting the decline in global real activity associated with higher U.S. real interest rate

OILIt is in the ascending channel for 15 minutes.
The blue line I drew is the middle 🔥
If it holds, it will climb to the channel ceiling again🔼 and if it breaks, it will correct to the channel floor🔽
Keep an eye on the blue line 🙂🕯

USOIL trading opportunities.After the "OPEC+ continued to increase production" on Monday, USOIL continued to fall to a four-year low near 55. However, it rebounded after opening low on Monday. It continued on Tuesday. Is it no longer able to fall?
Ludvig believes that it will continue to fall. Because the decline is caused by the growth of production capacity. The rise is caused by geopolitical strategic reserve materials. One of these two directly affects the trend of OIL, and the other indirectly.
The trend of economic data API/EAI will continue to be released. If the geopolitical weakening situation, the oil price data released is roughly negative, so it will continue to fall. But if the impact of geopolitics intensifies, this is a positive factor.
So the current trading direction that can be determined is to continue to short.
In terms of trading, traders with large funds can sell at the current price, and those with small funds can wait until the market returns to above 59 to sell.
The band trading center continues to update new real-time trading opportunities. If you don’t know how to trade, or don’t want to miss the next real-time trading opportunity, remember to follow me.

USOIL SENDS CLEAR BEARISH SIGNALS|SHORT
USOIL SIGNAL
Trade Direction: short
Entry Level: 64.59
Target Level: 60.50
Stop Loss: 67.30
RISK PROFILE
Risk level: medium
Suggested risk: 1%
Timeframe: 12h
Disclosure: I am part of Trade Nation's Influencer program and receive a monthly fee for using their TradingView charts in my analysis.
✅LIKE AND COMMENT MY IDEAS✅

Double bottom pattern for USOILFirst tp 70$
Second tp 80$
Oil in it ways make a beautiful pattern
I see DB pattern
For target you see two hidden gap

us oil (1w)repeating of structres...
as previous...
its supply is going to over right now... and it may a hard pulll back at this leve...
