Oil - Short Term Sell Trade Update!!!Hi Traders, on April 17th I shared this idea "Oil - Looking To Sell Pullbacks In The Short Term"
I expected to see bearish continuation until the two Fibonacci resistance zones hold. You can read the full post using the link above.
The price is currently holding in the first Fibonacci resistance zone.
Until both the Fibonacci resistance zones hold my bearish view still remains.
If you enjoy this idea, don’t forget to LIKE 👍, FOLLOW ✅, SHARE 🙌, and COMMENT ✍! Drop your thoughts and charts below to keep the discussion going. Your support helps keep this content free and reach more people! 🚀
-------------------------------------------------------------------------------------------------------------------
Disclosure: I am part of Trade Nation's Influencer program and receive a monthly fee for using their TradingView charts in my analysis.
USOIL.F trade ideas

USOIL BULLS WILL DOMINATE THE MARKET|LONG
USOIL SIGNAL
Trade Direction: long
Entry Level: 59.70
Target Level: 63.67
Stop Loss: 57.06
RISK PROFILE
Risk level: medium
Suggested risk: 1%
Timeframe: 12h
Disclosure: I am part of Trade Nation's Influencer program and receive a monthly fee for using their TradingView charts in my analysis.
✅LIKE AND COMMENT MY IDEAS✅

USOIL Crab Harmonic PatternThe potential for an increase in oil prices is on the horizon, especially as buyers seem to be showing interest at the golden Fibonacci level of 60.7 USD, which aligns with harmonic patterns resembling a crab.
This fascinating interplay between market psychology and technical analysis highlights how traders often react to specific price levels.
As we observe these developments, it’s essential to keep an eye on market trends and the underlying factors influencing oil prices.

Market Analysis and Trading Strategy of USOILThe USOIL market has witnessed significant fluctuations recently. Yesterday, the price broke below the key support level of $61.5, and then it has been declining all the way. As of today, it has approached the vicinity of $59.5. This downward trend reflects that the bearish force currently dominates the market.
From a technical analysis perspective, once the support level of $61.5 is broken, its nature will transform into a strong resistance level. The rapid decline of the price to $59.5 indicates strong bearish momentum. Currently, the focus of the market is on the $59 mark, which is of crucial importance. If this support level is breached, according to the continuity of the price trend and the technical pattern, USOIL is highly likely to continue to decline further. The next important support level is around $57.5. Conversely, if the price can be effectively supported near $59, based on the technical repair demand after being oversold, the price is expected to rebound.
Based on the above analysis, in terms of trading strategy, investors can consider taking a short position near $60. If the price breaks below $59, the short position can be held, with the target price set at $57.5. If the price stabilizes and rebounds near $59, the stop-loss order should be executed in a timely manner to avoid expanding losses. Given the frequent release of important data recently and the significant impact of these data, market volatility will increase significantly. Investors must trade with caution, strictly control their positions, and set reasonable stop-loss levels to cope with the possible sharp price fluctuations.
I am committed to sharing trading signals every day. Among them, real-time signals will be flexibly pushed according to market dynamics. All the signals sent out last week accurately matched the market trends, helping numerous traders achieve substantial profits. Regardless of your previous investment performance, I believe that with the support of my professional strategies and timely signals, I will surely be able to assist you in breaking through investment bottlenecks and achieving new breakthroughs in the trading field.

USOIL – Buyers Might Be Waking UpFrom last week, USOIL dropped aggressively from the 65.27 resistance zone and hit our 57.00 support target — a level we’ve been watching closely.
Now here’s where it gets interesting…
Current Observation:
The 57.00 support seems to be holding strong.
We’re starting to see signs that sellers might be losing momentum around this zone.
Price has reacted with a bounce, and if it sustains above 57.00, we could see the buyers step back in.
What I'm Watching:
– A confirmed hold above 57.00 could offer a buy opportunity, targeting to see a break above 59.5 first, then possibly 61.8 – 62.0.
– However, if 57.00 breaks, I’ll be shifting bias back to the downside, watching 55.10 next.
Key Levels:
– Support: 57.00 → 55.10
– Resistance: 59.5 → 62.0 → 65.27
At this point, it's all about how price reacts around 57.00 and 59.50.
A bounce and strong close above? I’ll be looking to go long.
Failure to hold? The sell pressure might continue.
Let’s see how this plays out. Trade safe.

Can oil prices continue to be shorted? Of courseSaudi Arabia made a major strategic shift, willing to accept low oil prices and unwilling to cut supply.
Oil prices fell sharply as a result.
It is expected that oil prices will hit 55-56 in the short term, so the operation is still mainly shorting oil prices. Overcapacity.

OIL: Very bearish Monthly closeOIL ST/MT Outlook: Sell
From FA perspective, Oil is in downtrend:
1- Worldwide recession is/will create a lower demand for oil.
2- Risk: Agreements between Iran-USA and Ukraine-Russia will fade out any risk related.
From TA perspective:
1- Monthly close is a strong bearish. A continuation down is expected.
2- Next major stop is around $40.


Crude Oil | Support Level 62.700-61.700Crude Oil reached support level.
Take Profit : 71.750
Stop Loss : 60.680

Rising Wedge and Triple topThe price has broken out of the rising wedge pattern followed by a pullback that has formed a triple top on the 1-hour timeframe, if the price makes a lower low, we will see a bearish impulse
WE ONLY TRADE PULLBACKS

WTI Crude Oil selling pressure below 6200The price sentiment for WTI Crude Oil remains bearish, in line with the prevailing downtrend. Recent price action shows an oversold rally, which has stalled near a previous consolidation zone around 6200 — a key resistance level.
Key Resistance Level: 6200
This level marks a previous intraday consolidation area and could act as a ceiling for the current rally.
Bearish Scenario:
If WTI fails to break above 6200, it may resume its decline toward:
5860 (near-term support)
5713
5550 (longer-term support)
Bullish Scenario:
A confirmed breakout and daily close above 6200 would shift momentum and open upside targets at:
6375
6533
6700
Conclusion:
WTI Crude Oil remains under bearish pressure unless it breaks and closes above 6200. Traders should monitor this level closely for signs of rejection or breakout.
This communication is for informational purposes only and should not be viewed as any form of recommendation as to a particular course of action or as investment advice. It is not intended as an offer or solicitation for the purchase or sale of any financial instrument or as an official confirmation of any transaction. Opinions, estimates and assumptions expressed herein are made as of the date of this communication and are subject to change without notice. This communication has been prepared based upon information, including market prices, data and other information, believed to be reliable; however, Trade Nation does not warrant its completeness or accuracy. All market prices and market data contained in or attached to this communication are indicative and subject to change without notice.

WTI CRUDE OIL: Buy signal at the bottom of the Channel Up.WTI Crude Oil turned bearish on its 1D technical outlook (RSI = 42.387, MACD = -1.000, ADX = 27.186) as it crossed under the 4H MA50. Still, it hit and is so far contained at the bottom of the Channel Up, which makes it a strong short term buy opportunity. Aim for the 4H MA200 (TP = 65.00).
## If you like our free content follow our profile to get more daily ideas. ##
## Comments and likes are greatly appreciated. ##

Buy Opportunity🛢️ WTI Crude Oil (4H) – Bullish Reversal Setup
WTI has hit a significant support zone near $59.30, aligning with a previous demand area and low-volume node from earlier consolidation. Price action suggests potential exhaustion in the selling momentum as indicated by the histogram flattening.
🟢 Entry: $59.32
🎯 Target: $64.69 – Previous swing high and key supply level
🛑 Stop Loss: $57.32
📊 Risk/Reward Ratio: 2.79
📆 Target Date: May 6, 2025
📈 Projected Move: +9.06% / +$5.37
🔍 Key Observations:
Strong support area with prior reaction.
Price now trading at low end of value zone (yellow-blue volume profile), often signaling reaccumulation.
Histogram shows bearish momentum waning – potential for shift in trend.
A move above $61.83 could accelerate bullish continuation.
📌 Bias: Bullish – Buy the dip with confirmation above $60 for safer entry.

OIL TRADE IDAHello
Hi everyone. Regarding oil movements, I see a long opportunity at the level of 59.61. If the price closes below 58.56, there is a possibility of a temporary rise before continuing to drop to 55.
good luck all
**My trading strategy is not intended to be a signal. It's a process of learning about market structure and sharpening my trading my skills also for my trade journal**
Thanks a lot for your support

OIL sell setup H1Hello! Friends,
Greetings. Please leave a Like if you like the idea.
Before start talking about technical Let's share your LOVE by giving me LIKES to support this work. Thanks in advance.

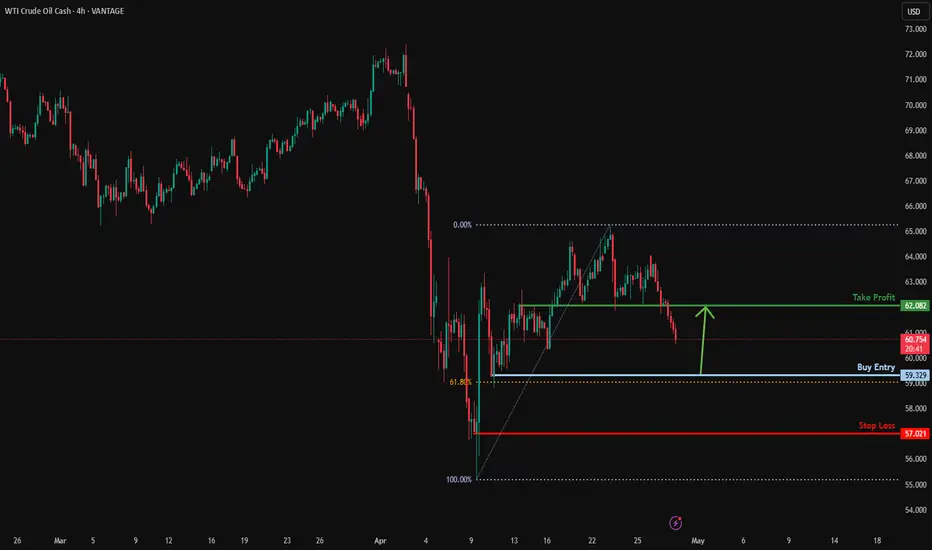
Could the price bounce from here?USO/USD is falling towards the support level which is a pullback support that lines up with the 61.8% Fibonacci retracement and could bounce from this level to our take profit.
Entry: 59.32
Why we like it:
There is a pullback support level that lines up with the 61.8% Fibonacci retracement.
Stop loss: 57.02
Why we like it:
There is a pullback support level.
Take profit: 62.08
Why we like it:
There is an overlap resistance level.
Enjoying your TradingView experience? Review us!
Please be advised that the information presented on TradingView is provided to Vantage (‘Vantage Global Limited’, ‘we’) by a third-party provider (‘Everest Fortune Group’). Please be reminded that you are solely responsible for the trading decisions on your account. There is a very high degree of risk involved in trading. Any information and/or content is intended entirely for research, educational and informational purposes only and does not constitute investment or consultation advice or investment strategy. The information is not tailored to the investment needs of any specific person and therefore does not involve a consideration of any of the investment objectives, financial situation or needs of any viewer that may receive it. Kindly also note that past performance is not a reliable indicator of future results. Actual results may differ materially from those anticipated in forward-looking or past performance statements. We assume no liability as to the accuracy or completeness of any of the information and/or content provided herein and the Company cannot be held responsible for any omission, mistake nor for any loss or damage including without limitation to any loss of profit which may arise from reliance on any information supplied by Everest Fortune Group.
OilusdEASYMARKETS:OILUSD
This wave analysis is one of many possible scenarios and is not a recommendation to buy or sell

XTIUSD – 4H Short Position ExplanationI have entered a short position on XTIUSD (WTI Crude Oil) based on a multi-timeframe bearish confluence setup:
Weekly and Daily Trend: The overall structure on both the weekly and daily charts is bearish, showing a consistent downtrend and favoring sell setups.
Daily Chart Structure: Recently, price formed a lower high on the daily timeframe, indicating continued bearish pressure and a rejection from a key resistance zone.
4H Price Action: On the 4-hour chart, price has broken a major support level, confirming the bearish momentum. This breakdown increases the probability of further downside movement.
Trendline & Structure: The pair is respecting a descending trendline, further supporting the bearish scenario.
RSI Confirmation: The RSI has dropped below 40 and continues to trend downward, reflecting bearish strength without yet being oversold.
This trade aligns with the higher timeframe trend, with a clear break of support and momentum favoring sellers. The risk is managed above the broken structure, and the setup offers a favorable risk-to-reward ratio.


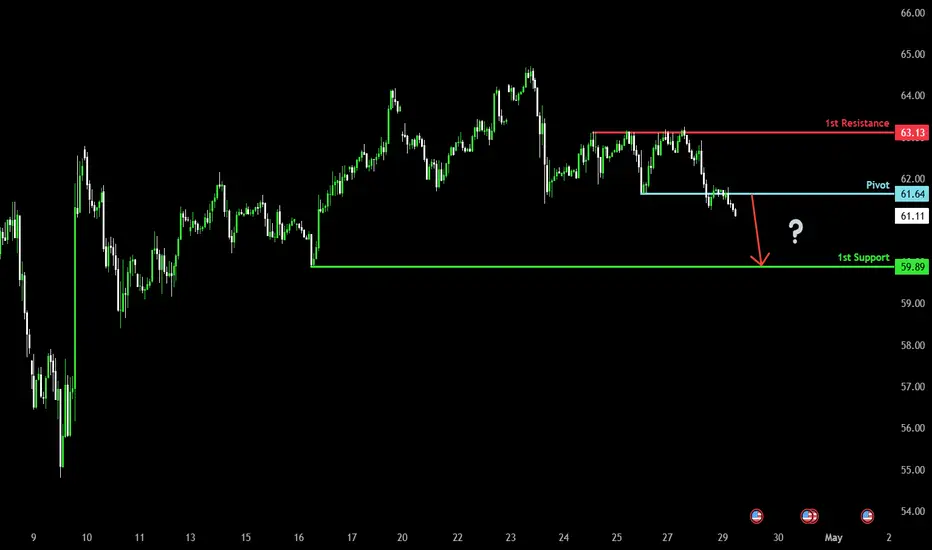
Bearish drop off pullback resistance?WTI Oil (XTI/USD) has rejected off the pivot which is a pullback resistance and could drop to the pullback support.
Pivot: 61.64
1st Support: 59.89
1st Resistance: 63.13
Risk Warning:
Trading Forex and CFDs carries a high level of risk to your capital and you should only trade with money you can afford to lose. Trading Forex and CFDs may not be suitable for all investors, so please ensure that you fully understand the risks involved and seek independent advice if necessary.
Disclaimer:
The above opinions given constitute general market commentary, and do not constitute the opinion or advice of IC Markets or any form of personal or investment advice.
Any opinions, news, research, analyses, prices, other information, or links to third-party sites contained on this website are provided on an "as-is" basis, are intended only to be informative, is not an advice nor a recommendation, nor research, or a record of our trading prices, or an offer of, or solicitation for a transaction in any financial instrument and thus should not be treated as such. The information provided does not involve any specific investment objectives, financial situation and needs of any specific person who may receive it. Please be aware, that past performance is not a reliable indicator of future performance and/or results. Past Performance or Forward-looking scenarios based upon the reasonable beliefs of the third-party provider are not a guarantee of future performance. Actual results may differ materially from those anticipated in forward-looking or past performance statements. IC Markets makes no representation or warranty and assumes no liability as to the accuracy or completeness of the information provided, nor any loss arising from any investment based on a recommendation, forecast or any information supplied by any third-party.
Heading into 61.8% Fibonacci resistance?WTI Oil (XTI/USD) is risng towards the pivot which has been identified as a pullback resistance and could reverse to the 1st suport which acts as a pullback support.
Pivot: 65.64
1st Support: 57.71
1st Resistance: 71.18
Risk Warning:
Trading Forex and CFDs carries a high level of risk to your capital and you should only trade with money you can afford to lose. Trading Forex and CFDs may not be suitable for all investors, so please ensure that you fully understand the risks involved and seek independent advice if necessary.
Disclaimer:
The above opinions given constitute general market commentary, and do not constitute the opinion or advice of IC Markets or any form of personal or investment advice.
Any opinions, news, research, analyses, prices, other information, or links to third-party sites contained on this website are provided on an "as-is" basis, are intended only to be informative, is not an advice nor a recommendation, nor research, or a record of our trading prices, or an offer of, or solicitation for a transaction in any financial instrument and thus should not be treated as such. The information provided does not involve any specific investment objectives, financial situation and needs of any specific person who may receive it. Please be aware, that past performance is not a reliable indicator of future performance and/or results. Past Performance or Forward-looking scenarios based upon the reasonable beliefs of the third-party provider are not a guarantee of future performance. Actual results may differ materially from those anticipated in forward-looking or past performance statements. IC Markets makes no representation or warranty and assumes no liability as to the accuracy or completeness of the information provided, nor any loss arising from any investment based on a recommendation, forecast or any information supplied by any third-party.

#USOIL 4HUSOIL (4H Timeframe) Analysis
Market Structure:
The chart is forming a classic Head and Shoulders pattern, which often signals a potential reversal from an uptrend to a downtrend. The left shoulder, head, and right shoulder are clearly visible, and the neckline is an important support zone to monitor.
Forecast:
A sell opportunity may be considered if the price breaks and closes below the neckline with confirmation. This breakdown could indicate the start of a bearish trend continuation.
Key Levels to Watch:
- Entry Zone: Look for a sell setup once the neckline is broken and retested as resistance.
- Risk Management:
- Stop Loss: Positioned above the right shoulder to minimize risk.
- Take Profit: Target nearby support zones or use a measured move technique based on the pattern's height.
Market Sentiment:
As long as the neckline holds and the breakdown is confirmed, bearish momentum is likely. A failure to break below the neckline would delay or invalidate the selling setup.

Crude OilU.S Oil Index
- Bullish Channel as an corrective pattern in Short Time Frame
- Break of Structure
- Fibonacci Level - 61.80%
- Head and Shoulder
- Completed Impulse and Corrective Waves " AB "
