April 25 crypto and stock market results📈 April portfolio recap: $2,293 in profit despite market decline
Each month, I publish performance reports to stay accountable and track the real results of my trading strategies across both stock and crypto markets.
In this post, I’ll break down my April 2025 performance — where my portfolio grew, even as the broader market declined.
🏛️ Stock market results: $1,144 profit
Despite a red month for the broader market, my equity portfolio performed well:
• Monthly return: just above 1%
• S&P 500 performance: -44 basis points (−0.44%)
Outperforming the S&P 500 in a down month is never easy, but my holdings managed to stay in the green.
🪙 Crypto portfolio: $1,139 recovery
My crypto allocation also showed strength in April, largely thanks to my liquidity pool strategy, which is finally beginning to yield real results.
• Monthly crypto return: just over 6%
• By comparison, simply holding BTC would have yielded around 14%
While my strategy didn’t beat Bitcoin in raw percentage terms, it offered recovery after previous drawdowns.
📊 Portfolio Overview
• Cumulative profit: $10,000+
• Average portfolio return since inception: ~11.5%
I began investing in 2020, and have steadily built a portfolio that balances growth with risk control. My approach involves both active management (via options and selective equities) and passive yield strategies in DeFi.
🔍 What’s Next?
I’ll continue to post live trade updates, monthly recaps, and strategy breakdowns. If you’re interested in real portfolio transparency and real-time insights — follow along.
USSP500CFD trade ideas

Moment of Truth for the S&P and Overall MarketsSeeing quite a significant Head and Shoulders pattern form now.
We've had a strong rally back up after the plunge.
Now we are testing the 50d SMA.
If we can't hold above this, things could get really bad.
If this Head and Shoulders sees follow through to the downside, we could be seeing a very significant bear market over the next year or so.
Critical point here!!!

$SPX Resistance and Downward Momentum Resistance and Downward Momentum at the Top of the Gap, which is also the top of Friday’s Implied move.
I took 5645/5675 0dte bear call spreads, 1/4 width to start and so far so good.
Let’s see if we get the downward pull of todays trading range here.

Another reversal 5600 now likelyWe came down to the top of the previous range and with the RSI as low as it got, the chances for reversal was high. I took profits and reversed long. I am now expecting 5600 and the 50 ma to finally get reached.

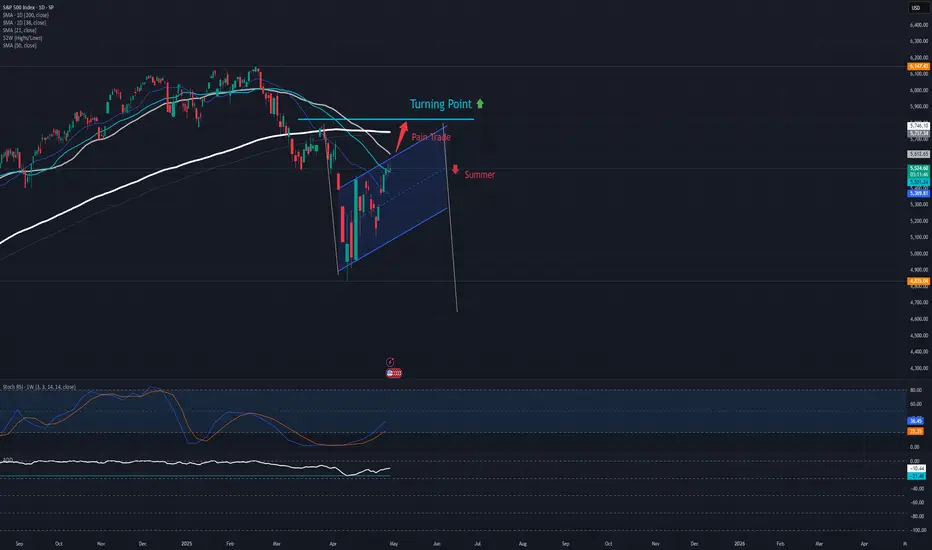
S&P 500 unlikely to return to up trendThe implemented tariff policy of the Trump Administration is expected to hit its fallout on the market by Q3 2025, consequentially the earnings of companies. If the SPX is to have a chance to return to the uptrend this year, it has to confirm two days closings above the turning point before summer.
The inverse effect of tariffs is that it soars with the price: any attempt to adapt on the net price point levers the total price; it's not a fixed number. This leverage applies also to inflation, resulting in consumer sentiment to sour. There is a natural time gap between the implementation of tariffs and the return of industry expected by the Trump Administration - the tariffs have been falling like a chainsaw on international business and supply relations, but rebuilding factories requires time and investment. In this gap the required investments will add pressure to companies' earnings...
These news and outlook brings out funds managers to sell America 'bigly' and to re-evaluate their diversification, bringing down stock prices eventually. The tariff-rebuild-gap is expected to set in by summer, but it is unclear when it would end: so far it is uncertain how much of the industry would return to America to produce and circumvent tariffs. A few big companies announced to build manufactories in the USA, but mostly they plan for only one factory and it still requires building. The Midterm Elections could set the Republican super-majority in both houses to fall and, by extension, have Congress retake the right to set and lift tariffs from the White House. However, it is unclear whether they would use their retaken privilege, as one truth about tariffs, like about all taxes: they're easily introduced, but can take generations to go away again.
All this forms a painstaking 2H scenario for 2025, its rock-bottom too early to call.
S&P 500 index Wave Analysis – 29 April 2025
- S&P 500 index broke key resistance level 5500.00
- Likely to rise to resistance level 5700.00
S&P 500 index recently broke the key resistance level 5500.00 (former support from March, which also stopped A-wave of the active ABC correction B from the start of April).
The breakout of the resistance level 5500.00 coincided with the breakout of the 50% Fibonacci correction of the downward impulse from February.
S&P 500 index can be expected to rise toward the next resistance level 5700.00, target price for the completion of the active impulse wave C.

Could The Stock Market Crash? - WARNING 🚨MartyBoots here , I have been trading for 17 years and sharing my thoughts on SPX .🚨
🚨 SP:SPX Could It Crash?🚨
Lets look into it deeper, very interesting chart but also a dangerous one. Need to see buyers soon or this is could be worse than people expect. 5-10% drop minimum and extreme bear could drop 40% total🚨
Watch video for more details

S&P 500 Rally Exhausted? Watch This Level for the Next Drop!The S&P 500 Index( SP:SPX ) has finally touched the Resistance zone($5,680-$5,500) as I expected in my previous post .
The S&P 500 Index is moving near the Resistance zone($5,680-$5,500) , the Resistance line, and Yearly Pivot Point .
Also, we can see the Regular Divergence(RD-) between Consecutive Peaks .
In terms of Elliott Wave theory , it seems that the S&P 500 Index is completing the Zigzag Correction(ABC/5-3-5) , and if the uptrend line breaks , we can confirm the end of the Zigzag correction .
When the S&P 500 Index started to rise on April 22 , Bitcoin also started to rise at the same time , so a decline in the S&P 500 Index can cause Bitcoin ( BINANCE:BTCUSDT ) to decline .
I expect the S&P 500 Index to drop to at least $5,313 AFTER breaking the uptrend line .
Note: If the S&P 500 Index touches $5,712, we can expect more pumps.
Please respect each other's ideas and express them politely if you agree or disagree.
S&P 500 Index Analyze (SPX500USD),2-hour time frame.
Be sure to follow the updated ideas.
Do not forget to put a Stop loss for your positions (For every position you want to open).
Please follow your strategy and updates; this is just my Idea, and I will gladly see your ideas in this post.
Please do not forget the ✅' like '✅ button 🙏😊 & Share it with your friends; thanks, and Trade safe.

S&P 500 correction before the global fall.S&P 500 correction before the global fall of the usa stock market.
Hey traders! I’m sure many of you have noticed that after the introduction of retaliatory tariffs, the markets started getting pretty choppy.
The S&P 500 took a serious dive.
• On the weekly chart, I’ve marked a support level + the 161.8% Fibonacci level, where we might see a bounce back to the $5680–$5800 range.
• But from there, I think we could see the start of a major crash—both in equities and crypto—that could last 1–2 years.
• Based on my estimates, the S&P 500 could drop back to 2020–2021 levels, a wide range of 2200–3000.
• For Bitcoin, we’re talking around $5000; for Ethereum, $100–$300; and for Solana, $2–$12.
3D Chart:
3W Chart:
Real-world events that could tank the stock market this hard:
Global Recession: If major economies (US, China, EU) slide into a recession at the same time—think trade wars, rampant inflation, or a debt crisis—investors will dump risky assets like hot potatoes.
Trade War Escalation: Harsher tariffs between the US and China/EU could wreck supply chains, crush corporate earnings, and spark a full-on market panic.
Geopolitical Conflict: A big blow-up—like a full-scale war or crisis (say, Taiwan or the Middle East)—could send capital fleeing to safe havens (gold, bonds), while stocks and crypto get slaughtered.
Collapse of a Major Financial Player: If a big bank or hedge fund goes bust (Lehman Brothers 2.0-style) due to an overheated market or bad debt, it could trigger a domino effect.
Energy Crisis: A spike in oil/gas prices (from sanctions or conflicts, for example) could kneecap the economy and drag risk assets down with it.
Market Bubble Burst: If the current rally turns out to be a massive bubble (and plenty of folks think it is), its pop could pull indexes down all on its own.
Looming Wars: A potential Russia-Europe war starting as early as 2025, or an Iran-Israel conflict that drags in multiple nations, could destabilize global markets, spike energy prices, and send investors running for the exits.

S&P 500: What’s Happening?S&P 500 Market Update
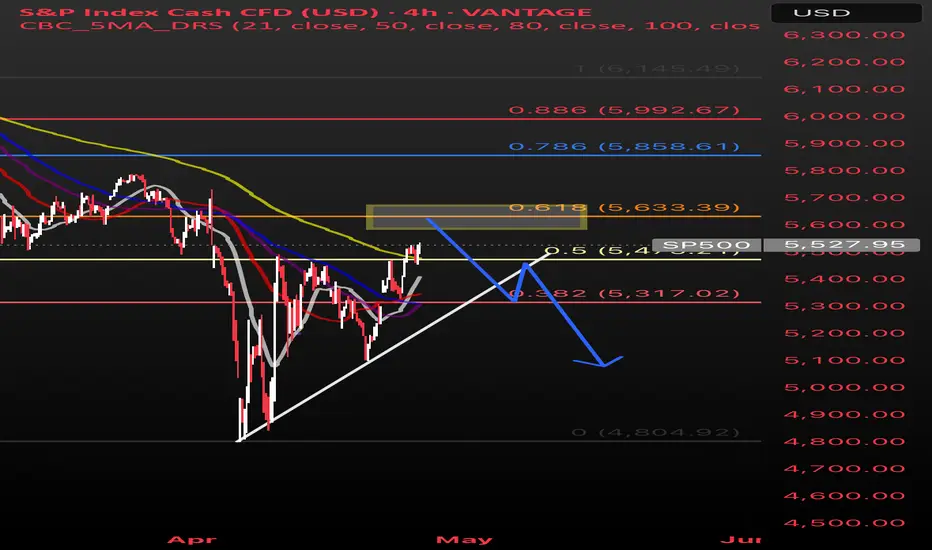
Recent changes to tariffs have made investors feel more confident, and because of that, the S&P 500 has broken out of a downward trend it had been stuck in. This breakout suggests prices could continue rising for now.
However, technical analysis shows that many investors might still be cautious. A lot of them may plan to sell if the market climbs back near $5,650 (faded yellow rectangle box on chart), trying to limit losses compared to when prices dropped to around $4,800 a few weeks ago.
If the market struggles to get past $5,650 (faded yellow rectangle box on chart), we could see prices fall again, possibly down to around $5,300, before the market settles for a bit and decides on its next big move.
• Blue line: shows the path I expect the market to take based on investor behavior and technical patterns.
• White line: shows the general trend where buyers typically step in. If the price falls through this line, it could signal more downside ahead.
BUY s&p 500Elliott wave forecast clearly indicates 3 wave ABC is ended.
a new ABC wave emerging to reach the previous highs
Traders can use this bullish recovery for short term oppertunity

What the S&P did and what to look forward to this coming week. A walkthrough different levels on the S&P for the short term (1-2 weeks).
The S&P broke above a key weekly downtrend line this past week, shifting the structure slightly more bullish in the short term. We’re now testing an important resistance zone with multiple possible scenarios ahead.
Scenarios for the Week Ahead:
Bullish:
If the S&P holds above the breakout zone (5484) and continues climbing, we could see a move toward 5,650 (near the declining 50SMA). Some minor pauses or consolidations could occur at moving averages, but overall momentum would remain constructive if buyers stay active.
Bearish:
If the S&P fails to hold above 5,484 and breaks back below the uptrend line, we could see a pullback toward (in this order) 10 and 20 EMAs, recent uptrend line, or at most the key level around 5,264. A deeper breakdown seems less likely unless broader selling pressure returns.
Neutral: Think this would be a chop between where it is at now and 5650.

Another move down for SPX500USD?Hi traders,
SPX500USD made a bigger orange X-wave last week into the Daily FVG.
So next week we could see the start of the last impulse wave down to finish the bigger (red) WXY correction. But it first has to close below the Daily FVG.
Let's see what the market does and react.
Trade idea: Wait for a change in orderflow to bearish, a small impulse wave down and a small correction up on a lower timeframe to trade shorts.
If you want to learn more about trading FVG's & liquidity sweeps with Wave analysis, then please make sure to follow me.
This shared post is only my point of view on what could be the next move in this pair based on my technical analysis.
Don't be emotional, just trade your plan!
Eduwave

Built Up Swing Short Bet Over the Last Day.Got another good chunk of the rally taking our net SPX long earnings to over 20% for the year on low risk (For context, our max DD is about 1/4 of what SPX is down this year).
I still would prefer to see 5800 for me to take a real big swing at the short (because I know at 5800 even if I am wrong I'll generally get some reaction to size down a bit in risk) but we may undershoot that.
I've build up my position around the 5400 sort of area. Small tolerance for stop zones. If I am wrong, I think 5800 would hit really quickly.
Update to below idea.

sp500A strong entry of buyers into the area. We will wait for it to return to the area we specified. Therefore, we are waiting for the price to come to an area, but if it does not come, we are not surprised because we expected a rise without a correction.

S&P500 repeating the 2019 recovery-Can hit 7000.The S&P500 index (SPX) is making a remarkable recovery as it completed yet another strong 1W green candle last week following the rebound on its Higher Lows Zone, near the 1W MA200 (orange trend-line).
This is a mirror price action with the last 1W MA200 rebound of the 2016 - 2019 Bullish Megaphone pattern, which not only recovered its previous All Time High (ATH) but also peaked on the 1.618 Fibonacci extension before the eventual 2020 COVID crash.
As a result, we believe that a 7000 Target is a very plausible one on the long-term.
-------------------------------------------------------------------------------
** Please LIKE 👍, FOLLOW ✅, SHARE 🙌 and COMMENT ✍ if you enjoy this idea! Also share your ideas and charts in the comments section below! This is best way to keep it relevant, support us, keep the content here free and allow the idea to reach as many people as possible. **
-------------------------------------------------------------------------------
Disclosure: I am part of Trade Nation's Influencer program and receive a monthly fee for using their TradingView charts in my analysis.
💸💸💸💸💸💸
👇 👇 👇 👇 👇 👇

Bull in a China Shop. The S&P 500 Index After 100 Days of TrumpPresident Donald Trump's first 100 days in office were the worst for the stock market in any postwar four-year U.S. presidential cycle since the 1970s.
The S&P 500's 7.9% drop from Trump's inauguration on Jan. 20 to the close on April 25 is the second-worst first 100 days since President Richard Nixon's second term.
Nixon, after taking office as President of the United States (for the second time) on January 20, 1973, witnessed the S&P 500 index fall by 9.9% in his first 100 days in office, due to the unsuccessful economic measures he took to combat inflation, which led to the recession of 1973-1975 when the S&P 500 index losses of nearly to 50 percent.
It all started in January 1973 in the best soap opera traditions of Wall Street, at the historical peaks of the S&P 500 index..
..But less than two years later it quickly grew into a Western with a good dose of Horror, because the scenario of a 2-fold reduction of the S&P 500 index was unheard those times for financial tycoons and ordinary onlookers on the street, since the Great Depression of the 1930s, that is, for the entire post-war time span since World War II ended, or almost for forty years.
Nixon later resigned in 1974 amid the Watergate scandal.
On average, the S&P 500 rises 2.1% in the first 100 days of any president's term, according to CFRA, based on data from election years 1944 through 2020.
The severity of the stock market slide early in Trump's presidency stands in stark contrast to the initial "The Future is Bright as Never" euphoria following his election victory in November, when the S&P 500 jumped to all-time highs on the belief that Mr. Trump would shake off the clouds, end the war in Ukraine overnight, and deliver long-awaited tax cuts and deregulation.
Growth slowed and then, alas, plummeted as Trump used his first days in office to push other campaign promises that investors took less seriously, notably an aggressive approach to trade that many fear will fuel inflation and push the U.S. into recession.
The S&P 500 fell sharply in April, losing 10% in just two days and briefly entering a bear market after Trump announced “reciprocal” tariffs, amid a national emergency that gave him free rein to push through tariffs without congressional oversight.
Then Trump began yanking the tariff switch back and forth, reversing part of that tariff decision and giving countries a 90-day window to renegotiate, calming some investor fears.
Many fear more downside is ahead.
Everyone is looking for a bottom. But it could just be a bear market rally, a short-term bounce of sorts.
And it's not certain that we're out of the woods yet, given the lack of clarity and ongoing uncertainty in Washington.
Time will tell only...
--
Best 'China shop' wishes,
@PandorraResearch Team

S&P500 is set to rebound to new highsDual EBP on the weekly and daily indicative of bullish price action and time frame allignment. S&P500 is set for new highs.

S&P 500: The Indicator to Watch Right NowWith US stocks bouncing on Trump’s backtracking over tariffs — just weeks after a 20% correction — it’s fair to say caution is the name of the game. Even though the headline risk has eased slightly, markets are still navigating through a fog of geopolitical noise and economic uncertainty.
In moments like these, where the fundamental picture feels muddy at best, objective technical analysis can offer clarity — not crystal-ball predictions, but structure and focus.
The Traditional Technical Backdrop
Traditional technical analysis isn’t about magic lines on a chart — it’s about mapping out price behaviour with tools that help us stay grounded. Structural levels, trendlines, and a couple of moving averages might seem basic, but they’ve stood the test of time because they do something incredibly useful: they make sense of chaos.
In the case of the S&P 500, several key structural levels should anchor any serious analysis. We’ve got the pre-sell-off highs from February, the April lows, and two interim levels — broken support levels that flipped to resistance during retracement rallies between February and April. These levels now act like milestones in the market’s memory.
Drawing a downward-sloping trendline through the swing highs during the correction gives us a good sense of the broader downtrend. More recently, we’ve also started to see a modest uptrend emerge from the April lows. That creates something of a wedge formation — a narrowing range that’s coiling tighter as buyers and sellers battle it out.
Simple moving averages like the 50-day and 200-day are useful additions here. While they’re lagging by nature, they give us immediate context for where price sits in relation to recent momentum and long-term sentiment.
US500 Daily Candle Chart
Past performance is not a reliable indicator of future results
The Indicator to Watch
There’s a good argument to be made that the most important indicator to watch right now, with the S&P 500 trying to claw back ground, isn’t a moving average or RSI — it’s Anchored VWAP.
Anchored Volume-Weighted Average Price (VWAP) is one of the most effective ways to cut through the noise and see who’s really in control — buyers or sellers. It tells you the average price that traders have paid for the index, weighted by volume, since a specific event or turning point. And unlike regular VWAP that resets daily, Anchored VWAP lets us choose a significant date and track how price interacts with that “anchor.”
If we anchor the VWAP to the February highs, we’re essentially tracking how the market has performed relative to that peak. This anchored VWAP line becomes a kind of gravity — it reflects the average cost basis of those who bought just before the sell-off. If price remains below it, it tells us those buyers are still underwater, and therefore less likely to add risk. Sellers, in that case, still hold the advantage.
On the flip side, if we anchor VWAP to the April lows, we get the average cost basis of the recent bounce. This line reflects where more optimistic, bottom-fishing buyers stepped in. If price holds above this level, it suggests those participants remain in profit — and potentially willing to buy dips.
Right now, the S&P 500 is stuck in a battle between these two anchored VWAP levels. One tracks the pain, the other tracks the hope. It’s a VWAP funnel, and it won’t last forever. Eventually, price will break above one and leave the other behind — and when it does, we’ll have an objective answer as to which side is winning.
Will it be the late bears holding on from February’s highs, or the early bulls from the April lows? The answer is coming. Keep your eyes on the anchored VWAPs — they’re telling the real story.
US500 Daily Candle Chart
Past performance is not a reliable indicator of future results
Disclaimer: This is for information and learning purposes only. The information provided does not constitute investment advice nor take into account the individual financial circumstances or objectives of any investor. Any information that may be provided relating to past performance is not a reliable indicator of future results or performance. Social media channels are not relevant for UK residents.
Spread bets and CFDs are complex instruments and come with a high risk of losing money rapidly due to leverage. 83% of retail investor accounts lose money when trading spread bets and CFDs with this provider. You should consider whether you understand how spread bets and CFDs work and whether you can afford to take the high risk of losing your money.

Short Pullback Bigger RallySPX Daily Chart
SPX has made two island reversals and gapped up.
There are two resistances near 5500 and 5700. Some short pull backs in this region.
Thereafter, a rally up to the earlier high of 6200.

SPY/SPX500: Bearish Setup Ahead of Key Macro Events🔍 15-Min Chart Analysis – April 30, 2025
The S&P 500 (SPX500) is currently facing resistance near the 5,560.65 zone, a confluence of a key Fibonacci level (0.382 retracement) and a rising wedge upper boundary. Price has shown signs of rejection after a recovery from the ORB low of 5,505.88, and is struggling to break above 5,557–5,560, which aligns with a prior supply zone.
🔧 Technical Breakdown:
Bearish Rising Wedge Formation: Price is respecting the wedge trendlines, suggesting a potential breakdown.
Fibonacci Confluence Zones:
Resistance: 0.382 at 5,557.18
Support: 1.382 extension aligns with 5,508.75, which is just above the ORB low and a possible target.
Short Bias Trigger: A clean break below the wedge support (~5,545) could accelerate downside.
Target Zones:
🎯 First target: 5,524.39 (ORB low)
🎯 Second target: 5,508–5,505 area (Fibo 1.382 + ORB range support)
🔮 Probability Outlook:
Bearish bias: 65%
Bullish breakout: 25%
Sideways consolidation: 10%
🧠 Macro Context:
With U.S. GDP and FOMC decisions imminent, volatility is expected to spike. A break below wedge support could trigger a retracement toward key support zones. Be cautious of false breakouts as macro catalysts come into play.
📌 Watch the 5,545 level closely. Rejection + volume drop = high-probability short setup.

SPX500 (4H) LONG POSITIONGreeting there traders this is my idea on SP500 and it is Long.
We can clearly see a recovery from the “Support Area” (yellow zone), after a wave formation (probably a completed Elliott Wave correction).
You are currently in a very impulsive uptrend.
Momentum looks strong, with no major retracements — meaning that buyers would currently be in a dominating position.
Key Levels
Support Level (red): 5.019 – 5.091
This is the “ultima ratio” zone where the price made a strong rebound.
Softer Support: 5.276 – 5.282 (where you are now)
This is the zone of possible correction, as you marked.
Resistance/Target: 6.150 – 6.156
If the current trend holds and there is no major retracement below 5,250, it is very likely that we will test the 6,000–6,150 level in the coming days.
The price is currently in a “blast-off” phase — if volume remains strong, you can hit the TP as early as late April or early May.
I predict that we have started an uptrend towards a new ATH. I believe that the market will start to "fly" already on Monday or Tuesday. Possible catalysts: Trump strikes a deal with China, announces a pause in the trade war, or Powell responds with an emergency rate cut.
My goal is mid $6,000 to low $7,000 by July 4th (maybe sooner). After that I expect a 60-70% drop.

US500 TRADE IDEAhi again
The US500 has shown strength by breaking the resistance at 5483.5 and is now at 5535. If the price reaches 5604.6 and a pullback occurs, targeting a temporary decline at the 50% Fibonacci retracement level is a good strategy.
Fibonacci retracement is often used to identify potential support and resistance levels where the price might pause or reverse. The 50% level is one of the commonly watched levels by traders as it often indicates a significant turning point in price movement.
good luck all
**My trading strategy is not intended to be a signal. It's a process of learning about market structure and sharpening my trading my skills also for my trade journal**
Thanks a lot for your support
