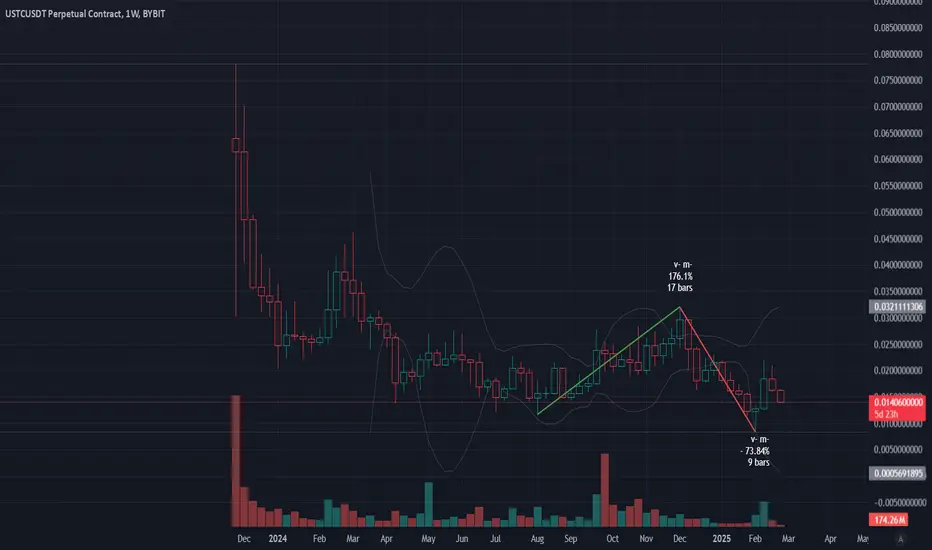
USTCUSDT 4D Analysis USTC ~ 4D Analysis
#USTC This trade is very high risk
Buy gradually if you still have confidence in this coin with a short term target of at least 10%+.

$USTC Forming Ascending Triangle🚨 OTC:USTC Forming Ascending Triangle 🚨
OTC:USTC is forming an ascending triangle pattern and is approaching a key red resistance zone. A breakout above this level could signal a strong bullish move.
📈 Technical Overview:
Pattern: Ascending Triangle
Resistance Zone: Red area currently being

LONG USTC News about TerraLoss claims
prevois day were small pump , and this day , that could be just gathering stop lossess to go higher

REPEG ? Imagine that some of the stablecoin going to be swing .... you should know the coin which have had at least more stable than other.
That price 0,15 is good level for last 2 years time and show activity
CVD are not decreasing much , just nobody buy while snow ball falling, that is reason fo
USTC/USDTKey Level Zone: 0.019000 - 0.019500
HMT v5 detected. The setup looks promising, supported by a previous upward/downward trend with increasing volume and momentum, presenting an excellent reward-to-risk opportunity.
HMT (High Momentum Trending):
HMT is based on trend, momentum, volume, and market s

USTC/USDTKey Level Zone: 0.017160 - 0.017440
HMT v5 detected. The setup looks promising, supported by a previous upward/downward trend with increasing volume and momentum, presenting an excellent reward-to-risk opportunity.
HMT (High Momentum Trending):
HMT is based on trend, momentum, volume, and market s

USTC trade planUSTC trade plan
USTC/USDT is not going to break this range resistance in one attempt. A 15-30% drop is coming.
key points
- strong resistance holding
- expecting a rejection and pullback
- risk is under your control, manage accordingly
- not financial advice, do your own research
tr

LONG USTC Bullish setup, - shorts are retreating and we so lot of times just go through a levels.
Havn't high volumes, that a strange , but probably some still believe in falling
we have serial of dodji on 1H TF, each one higher then previos , it show right befor big move
We going to take a


See all ideas
Summarizing what the indicators are suggesting.
Oscillators
Neutral
SellBuy
Strong sellStrong buy
Strong sellSellNeutralBuyStrong buy
Oscillators
Neutral
SellBuy
Strong sellStrong buy
Strong sellSellNeutralBuyStrong buy
Summary
Neutral
SellBuy
Strong sellStrong buy
Strong sellSellNeutralBuyStrong buy
Summary
Neutral
SellBuy
Strong sellStrong buy
Strong sellSellNeutralBuyStrong buy
Summary
Neutral
SellBuy
Strong sellStrong buy
Strong sellSellNeutralBuyStrong buy
Moving Averages
Neutral
SellBuy
Strong sellStrong buy
Strong sellSellNeutralBuyStrong buy
Moving Averages
Neutral
SellBuy
Strong sellStrong buy
Strong sellSellNeutralBuyStrong buy
Displays a symbol's price movements over previous years to identify recurring trends.