$USUAL - Triple Bottom Scalp Long$USUAL | 4h
**Weekend scalp long setup**
We're seeing a potential **triple bottom** forming on the local timeframe, indicating strong demand around this support zone. Price has tested this level three times without a breakdown, suggesting seller exhaustion.
If we hold above the most recent low,

USUAL Idea - USUAL/TheterHey traders!
Sorry, no chart Analysis!
My suggestion is to enter above the $0.1530 price range
With targets:
1- $0.1650
2- $0.1790
3- $0.1900
There is a possibility of a price correction to the $0.1400 range
Good luck

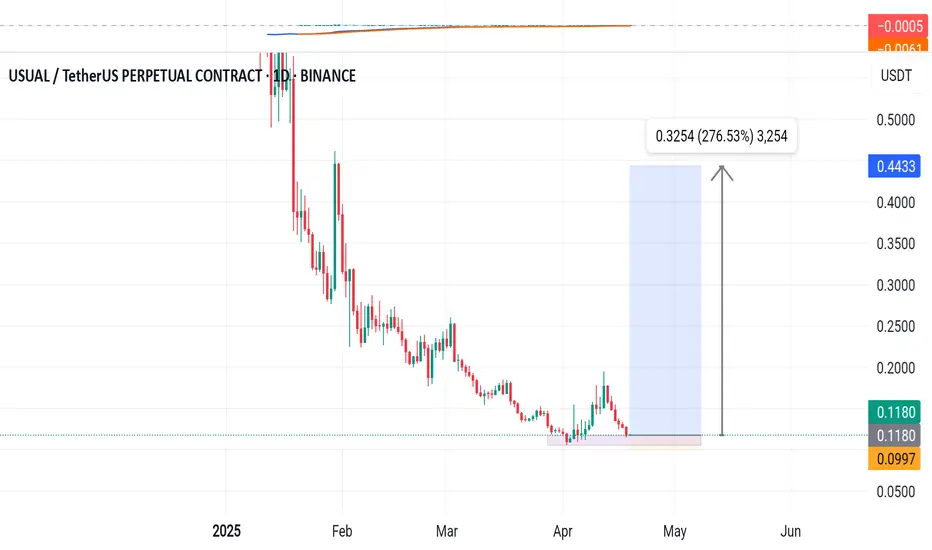
USUAL is waking up - the beginning of a new bullish wave?This analysis is an update of the analysis you see in the "Related publications" section
We previously had accurate analyses of USUAL, correctly identifying the highs and lows.
Based on the type of custom order flow visible on the chart and recent candlestick formations, it seems that the buy orde

USUAL ANALYSIS (8H)After wave A was completed, from the point where we placed the red arrow on the chart, it seems the price has entered wave B.
Wave B is a bearish symmetrical wave, and it currently appears that we are in the early stages of wave I, which is a bearish wave.
From the supply zone, we expect a rejecti

USUSAL/USDTLong
Trading Plan USUAL/USDT (4H):
1. Support & Entry:
Support: 0.139–0.14.
2. Target Profit:
TP1: 0.16–0.17.
TP2: 0.20–0.2053.
3. Stop Loss:
0.1289

USUual short to new lows $0.1787Am anticipating that Usual usd might start to dump back down from here all the way back down to $0.1882 area where I'll be looking to exit. I have my target lower at $0.1787 area as its day time now in New york session time.
So could get more volume than usual to dump down faster...hopefully for t

USUAL/USDT Rising Wedge – Bulls in Control, But Can It Hold?🚀 Rising Wedge – Bulls in Control, But Can It Hold?
I'm currently long on USUAL/USDT as price moves within this rising wedge on the 1H chart. While this pattern often signals a potential breakdown, momentum is still strong for now.
📊 Key Observations:
🔹 Rising wedge pattern forming – typically bea

USUAL is bullish (2H)Given the formed trigger line and the fact that the price is making higher Lows below this trigger line, we can look for buy/long positions on the order blocks formed below the price.
The targets are marked on the chart.
A 4-hour candle closing below the invalidation level will invalidate this ana

USUAL analysis (4H)It seems that the correction for this asset has started from the point where we placed the red arrow on the chart.
This correction appears to be a diamond-shaped diametric.
Currently, we seem to be in wave F of this diametric. The price may reject downward from the red zone.
A daily candle closin

See all ideas
Summarizing what the indicators are suggesting.
Oscillators
Neutral
SellBuy
Strong sellStrong buy
Strong sellSellNeutralBuyStrong buy
Oscillators
Neutral
SellBuy
Strong sellStrong buy
Strong sellSellNeutralBuyStrong buy
Summary
Neutral
SellBuy
Strong sellStrong buy
Strong sellSellNeutralBuyStrong buy
Summary
Neutral
SellBuy
Strong sellStrong buy
Strong sellSellNeutralBuyStrong buy
Summary
Neutral
SellBuy
Strong sellStrong buy
Strong sellSellNeutralBuyStrong buy
Moving Averages
Neutral
SellBuy
Strong sellStrong buy
Strong sellSellNeutralBuyStrong buy
Moving Averages
Neutral
SellBuy
Strong sellStrong buy
Strong sellSellNeutralBuyStrong buy
Displays a symbol's price movements over previous years to identify recurring trends.