VANRYUSDT 1D AnalysisVANRY ~ 1D Analysis
#VANRY Buy after successfully penetrating this resistant line with a short -term target of at least 10%+ from here.
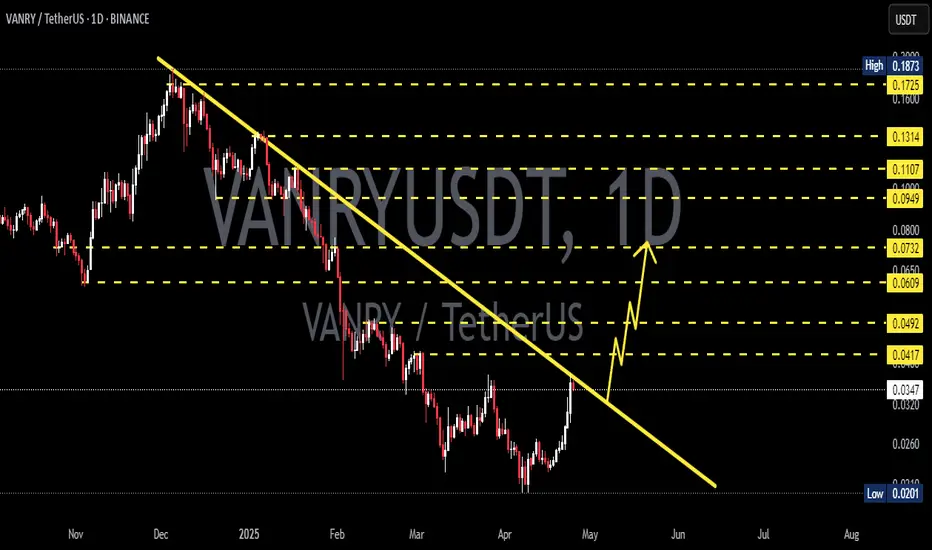
5-wave Elliot structure! After a perfect bounce, VANARY is struggling with 3 major resistance now. first the ~$0.03665 level; second, the trend line which is suppressing the bullish momentum for about 3 months; third, a bearish RSI divergence almost in all time frames. here's a trade setup:
Long it if it breaks ~$0.03665:

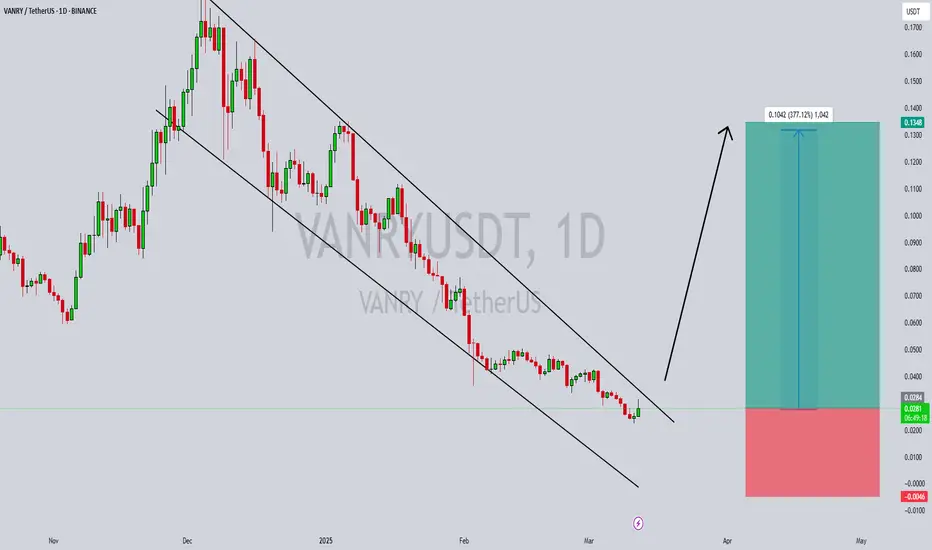
VANRY BREAKOUT>>> 100% pump incoming....As we see the trend, the Vanry made the bottom now is reclaimin the price slowvly but goind up. Very soon to breakout and move on for other resistances, so this is a good buy here..
Not financial adice .)

Vanar Morgulis, boizSoo, Do u think Im done?
Nooope :) Patience and cold calculation are what is needed in trading high-risk assets.
AND THIS EXPERIENCE COST ME A LOT!! I share it with you.
Anyway. I have been studying trading platforms for a long time and I am returning to the game, faster, smarter, stronger.. as it

Vanar Chain VANRY on the wayWhat is Vanar Chain (VANRY)?
Vanar Chain represents a multifaceted blockchain ecosystem, engineered to cater to a diverse range of applications, from entertainment to mainstream utility. Central to its architecture is the native gas token, VANRY, which plays a crucial role in facilitating transactio

VANRY Long Trade SetupOn 4hr time frame, clean Change Of Character (ChoCh) has been observed indicating sign of strength. Price is at demand , Stoploss: 0.022, Targets: 0.0423 & 0.05

Vanry Limit order long to $0.042 Today!I have a limit order setup to long vanry whatever that is, cool name.
Entry: $0.03443
Stop: $0.03242
Going to bed now.
IF when I wake order is filled. I'll look to scale into the position if ideal.

VANRYUSDT Approaching a Breakout from Falling Wedge VANRYUSDT is currently forming a falling wedge pattern, a bullish technical setup that traders are closely watching. This pattern often signals a potential breakout, and with strong volume backing the movement, the chances of a significant price surge are increasing. As the price consolidates within
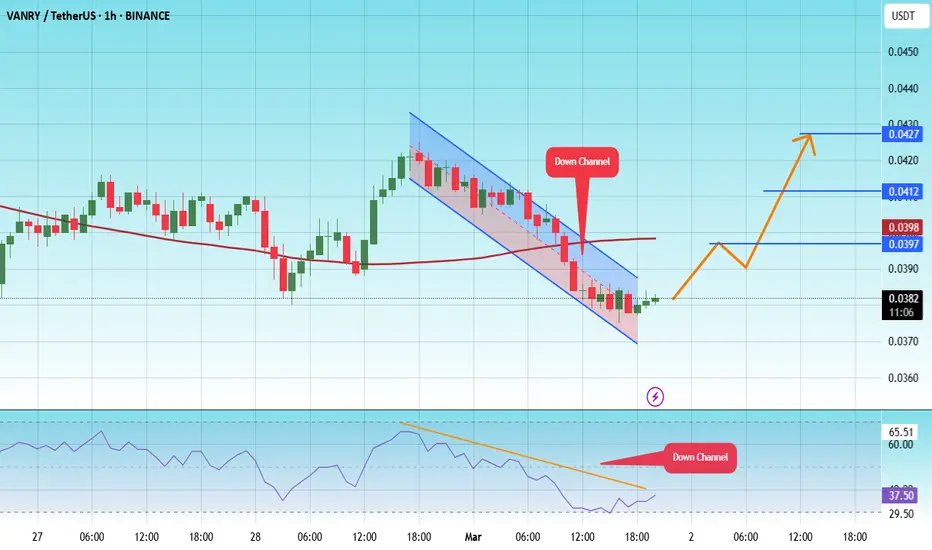
#VANRY/USDT#VANRY
The price is moving in a descending channel on the 1-hour frame and is expected to continue upwards
We have a trend to stabilize above the moving average 100 again
We have a descending trend on the RSI indicator that supports the rise by breaking it upwards
We have a support area at the l
VANRYUSDTWe can attempt to buy VANRYUSDT from specified level as it make HL , also 0.618 FIB level intact indicate that it moves upward.
SL , TP mention in chart.

See all ideas
Summarizing what the indicators are suggesting.
Oscillators
Neutral
SellBuy
Strong sellStrong buy
Strong sellSellNeutralBuyStrong buy
Oscillators
Neutral
SellBuy
Strong sellStrong buy
Strong sellSellNeutralBuyStrong buy
Summary
Neutral
SellBuy
Strong sellStrong buy
Strong sellSellNeutralBuyStrong buy
Summary
Neutral
SellBuy
Strong sellStrong buy
Strong sellSellNeutralBuyStrong buy
Summary
Neutral
SellBuy
Strong sellStrong buy
Strong sellSellNeutralBuyStrong buy
Moving Averages
Neutral
SellBuy
Strong sellStrong buy
Strong sellSellNeutralBuyStrong buy
Moving Averages
Neutral
SellBuy
Strong sellStrong buy
Strong sellSellNeutralBuyStrong buy
Displays a symbol's price movements over previous years to identify recurring trends.