Is It Over?Today's red Doji candle at the underside of the downtrend line is a high potential short entry point if not already. Despite the rally the past week or so, it is far from convincing...no real conviction to buy this market and who can blame them.
The current wave 2 bounce will be followed by wave 3 down as the most likely scenario, or we are in a wave 4 to be followed by a wave 5 to complete, any firm close below the lows gives us our answer.
Gold is selling off, our $3400 target was met and reversed in a now wave 4 down, this may approach the $3160 area, or a sideways move before another strong wave 5 up.
This is a great opportunity to accumulate physical metals to protect yourself from the coming reset.
Appreciate a thumbs up, Good Trading and God Bless you all!
US30 trade ideas

DOW/US30 - we hope everyone make million last nightTeam, yesterday was a big win for all of us, twice the DOW/NAS massive win
today, the market will likely pull back toward the price set in the chart
make sure you have tight stop-loss
also, once it drops more than 50 points, bring stop loss to BE
we are looking at around 40930-40850
The interest rate decision within 12 hours time frame,
we expect the market will be volatile if it dumps toward our LONG entry position, which I set out in the chart.
Follow that, and you will kill the market with me
UNTIL then, I wish you all the best
SHORTPrice is expected to correct from the upper pivot back down, short with tight stop above the upper pivot level. Trade safe

US30 shortWhat is a bear market?
A downward market with strong rallies. we are around a turn around area. Positive job data is just hysteria, false confidence.
>Momentum to the upside fading
>lower high on 5 mins
>countertrend!

US30 – Rejection from Supply Zone! Dow Heading Lower?Timeframe: 1H | Strategy: Supply & Demand + Price Action
The Dow Jones just tagged a key supply zone near 40,965 and printed a clean rejection candle — a potential signal that bulls are losing control.
Technical Outlook:
Supply Zone (Resistance): 40,965 – 41,020
Breakdown Point: Below 40,486 = possible short trigger
Demand Target Zone: 39,938 – 40,000 (orange block)
Observations:
Price attempted a breakout but was rejected at the top of the supply zone
A clean bearish candle has formed at resistance
Market sentiment may be shifting ahead of upcoming U.S. data (see icon)
Trade Idea (Bearish Bias):
Entry: Below 40,486
Target: 39,938
Stop Loss: Above 41,020
Watch for volume confirmation and retest of the breakdown level.
Invalidation:
If price closes above 41,020 on strong momentum, the bearish setup is off the table.
Fundamental Alert:
US data/events may trigger volatility soon — watch for fakeouts or sharp reversals.
Will the Dow retrace to the 40K zone, or is this a false sell signal? Drop your view below!
Like & follow for more clean price action setups!
#US30 #DowJones #PriceAction #SupplyAndDemand #LuxAlgo #TradingStrategy #TechnicalAnalysis #Indices #BearishReversal #TradingView

Hanzo | US30 15 min Breaks – Confirm the Next Bullish Move🆚 US30 – Hanzo’s Strike Setup
🔥 Timeframe: 15-Minute (15M)
——————
💯 Main Focus: Bullish Breakout at 40500
We are watching this zone closely.
———
Analysis
👌 Market Signs (15M TF):
• Liquidity Grab + CHoCH at 40420
• Liquidity Grab + CHoCH at 39870
• Strong Rejections seen at:
➗ 39900 – Major support / Key level
➗ 40300 : 40400 – Proven resistance
🩸 Key Zones to Watch:
• 40200 – 🔥 Bullish breakout level X 3 Swing Retest
• 40550 – Strong resistance (tested 5 times)
• 40200 – Equal lows
• 40420 – Equal highs

YM (US30): Trend in daily time framePlease pay special attention to the accurate trend, channels, and magic colored levels.
Its very sensitive setup, ...............<<<<<<<<<<<<<<<<<<<<<<<
Be careful
BEST
MT

Update on US302:1 RR hit ✅ Day is completed. I will now leave the market alone and go enjoy the rest of my day. I pray you too will have a blessed end of day and weekend Reflect on the week, Rest and Enjoy your time with your loved ones

Is everyone missing the leading diagonal Ive seen conflicting Elliot Wave Counts with both Bullish counts suggesting a new ATH is at hand as the decline is only a 3 wave decline and not five and bearish counts suggesting this is only a bear market rally since the Trump Tariff Tantrums.
However if we look at the decline as either a leading diagonal in a primary 4th Wave of an overall bull market or a leading diagonal which often occurs in reversal of trend from Bull to bear or vice versa.
What is not commonly recognized is that the C wave in these structures is often pronounced and extended.
If this count is correct the Dow has about 1000 points of upside before a very sharp decline in an E wave that will probably throw-over the lower trendline and find support in the 35000 area for a significant Wave 2 or B wave rally.
The typical characteristics of the e wave are sharp and deep.

Us30 longLong position from 41200. I think the 41400 region gets hit pretty soon.
If not tonight , tomorrow when stocks open i think she will start jumping higher.

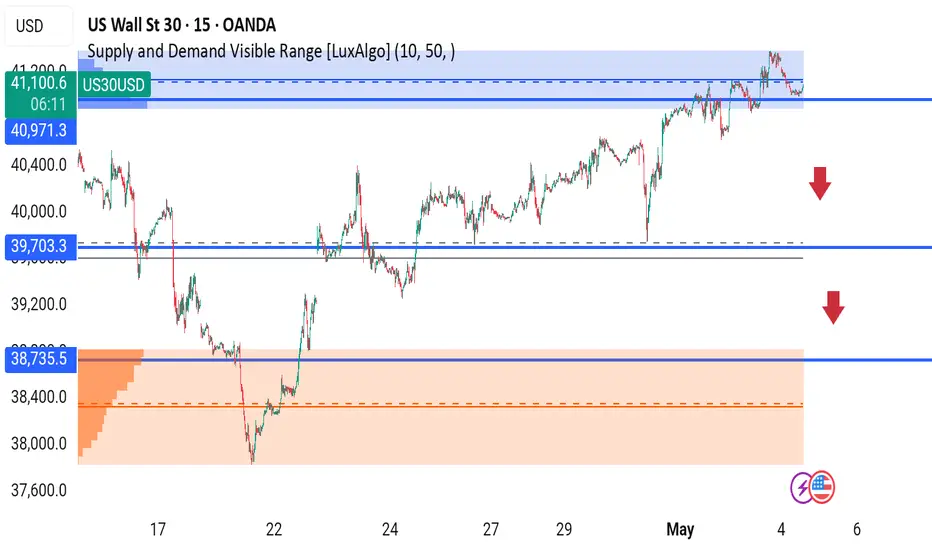
US30 – Key Supply Rejection at 41,000 | Is a Pullback ? The Dow Jones (US30) is currently trading at 41,089, slightly below the critical supply zone between 41,000 - 41,150, as identified by LuxAlgo’s Supply & Demand Visible Range. Price is showing signs of exhaustion after testing the top of the range, hinting at a potential short-term correction.
Chart Breakdown:
Supply Zone: 41,000 – 41,150 (visible resistance from recent price reaction).
Current Price: 41,089
First Support: 40,971 – the last breakout zone.
Next Support: 39,703 – major structure break level.
Demand Zone: 38,735 – 38,000 (bullish reversal zone, high volume node).
Bearish Scenario:
A clean break below 40,971 could confirm short-term bearish momentum.
Watch for price to fill the inefficiency gap toward 39,703 and possibly test 38,735 if weakness continues.
Red arrows on chart signal likely downside zones if buyers fail to defend higher levels.
Bullish Scenario:
Reclaim and close above 41,150 on strong volume may invalidate the bearish bias and push price to new highs.
Upcoming Volatility Alert:
Key U.S. economic news is on the calendar (highlighted on chart) – could cause sharp movement in either direction. Stay alert!
Trade Idea: Look for short entries around current levels with stops above the supply zone. Target the 39,703 and 38,735 levels with proper risk management.
---
Will Dow stay strong or finally give in to bearish pressure? Let me know your thoughts in the comments!
#US30 #DowJones #SupplyAndDemand #TechnicalAnalysis #SmartMoney #VolumeProfile #LuxAlgo #PriceAction #Forex #Indices #MarketUpdate
DowJones INTRADAY at pivotal zone Key Support and Resistance Levels
Resistance Level 1: 41200
Resistance Level 2: 42000
Resistance Level 3: 42710
Support Level 1: 39446
Support Level 2: 38490
Support Level 3: 37840
This communication is for informational purposes only and should not be viewed as any form of recommendation as to a particular course of action or as investment advice. It is not intended as an offer or solicitation for the purchase or sale of any financial instrument or as an official confirmation of any transaction. Opinions, estimates and assumptions expressed herein are made as of the date of this communication and are subject to change without notice. This communication has been prepared based upon information, including market prices, data and other information, believed to be reliable; however, Trade Nation does not warrant its completeness or accuracy. All market prices and market data contained in or attached to this communication are indicative and subject to change without notice.

Us30 longThis is a very short term trade..
1 is a wave of fear
2 is a wave of panic
3 is a wave of stop outs, (I was stopped out too)
after wave3 buyers come in hot
I would advise entering after break and retest of the trendline. to recent high

Dow Jones Wave Analysis – 2 May 2025- Dow Jones broke resistance zone
- Likely to rise to resistance level 42000.00
Dow Jones index recently broke the resistance zone between the pivotal resistance level 40815.00 (former support from March and the top of wave A from the start of April) and the 61.8% Fibonacci correction of the downward impulse 5 from March.
The breakout of this resistance zone continues the C-wave of the active ABC correction (2) from the start of April.
Dow Jones index can be expected to rise to the next resistance level 42000.00 (target price for the completion of the active impulse wave C).

US30 Trading Into Major Resistance - Look For Dow Jones Retrace🔍 US30 Analysis: At the moment, I'm watching the US30 as it looks overextended 📈 and is trading into previous highs. 🧱 If you look left on the chart, it's approaching a key resistance level on both the weekly and daily timeframes.
I’m expecting a potential retracement 🔁 and monitoring for a bearish break of structure on the 30-minute timeframe ⏱️ as a possible setup for a counter-trend short 📉 — aiming for the imbalance zone visible on that timeframe.
📏 Drawing a Fibonacci retracement from the recent swing low to high, the 50% equilibrium 🔄 lines up perfectly with the imbalance area, adding confluence to the idea.
📚 This is shared for educational purposes only and should not be considered financial advice 💼.

US30 – Chop or Fakeout?🔴 US30 – Chop or Fakeout? 🔴
May 2, 2025 – 1H Chart Update
After the bullish breakout above 40,700 yesterday, US30 surged to 41,051, but we’re now seeing price stalling just under that level, forming a potential double top or distribution pattern ⚠️
📊 Technical Breakdown:
🧱 Price rejected at ~41,050 (previous swing high zone)
📉 Small pullback forming after strong bullish leg
📍 Key short-term support still at 40,700
🧠 Market could be consolidating post-FOMC run or prepping for a deeper pullback
🎯 What to Watch:
Bullish Continuation Setup:
✅ Needs a 1H candle close above 41,050
🎯 Target: 42,000 → 42,359 resistance zone
Bearish Scenario:
🔻 Break below 40,700 flips structure short
🎯 Downside targets: 40,260 → 39,775
Neutral Bias If:
Price consolidates between 40,700 – 41,050 = no clear trend → stay flat

KEEP BUY ON US30!!!!!!Yesterday us30 completed +3,700pips from my entry point right now we have a liquidity sweep from the sell side am still going long from this point with my initial target at 40,701
JOIN AND ENJOY.........

Possibility of uptrend Given the behavior of the index within the current resistance range, possible scenarios have been identified. It is expected that after some volatility, a corrective trend will form.

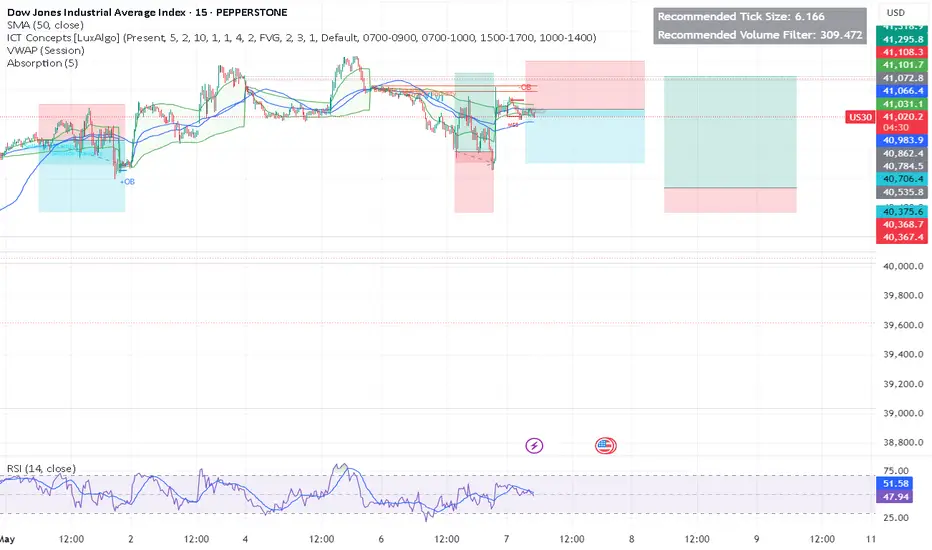
Trade Idea: Long (MARKET)Technical Confluence:
Daily Chart:
• Strong bullish engulfing recovery from recent support (~37,700).
• MACD starting to curl back up from deeply negative levels — possible trend reversal.
• RSI recovering above 50 (currently 52.49), suggesting bullish strength resuming.
15-Min Chart:
• Sustained uptrend with pullbacks respecting the moving average.
• MACD crossing positive territory.
• RSI at 64.77 with room to move higher before hitting overbought levels.
3-Min Chart:
• Tight consolidation after a sharp breakout to 40,766 — forming a potential bull flag.
• RSI at 58.89 — mid-level with upward momentum potential.
• MACD histogram shrinking — possible continuation breakout imminent.
⸻
Fundamental Context:
• Market Sentiment: U.S. markets are generally supported due to strong earnings reports and decreasing recession fears. Treasury yields have stabilized, and risk appetite is returning.
• Upcoming Events: FOMC rate decision is key — bullish bias if they hold or soften tone.
⸻
Trade Details:
• Entry: 40,770
• Price is consolidating just under this resistance. Enter on breakout with volume confirmation.
• Stop Loss (SL): 40,350
• Below recent support on the 15M chart and under the moving average. Conservative SL with volatility in mind.
• Take Profit (TP): 41,450
• Measured move from the flag pattern and aligns with Fibonacci extension and historical resistance.
FUSIONMARKETS:US30

US30 - LONGWaiting for the retest all day and finally got it in after hours trading. Looking for price to continue to the upside now that we got the retest.

"US30/DJI" Index Market Bullish Robbery (Swing Trade Plan)🌟Hi! Hola! Ola! Bonjour! Hallo! Marhaba!🌟
Dear Money Makers & Robbers, 🤑 💰💸✈️
Based on 🔥Thief Trading style technical and fundamental analysis🔥, here is our master plan to heist the "US30/DJI" Index Market Heist. Please adhere to the strategy I've outlined in the chart, which emphasizes long entry. Our aim is to escape near the high-risk YELLOW MA Zone. It's a Risky level, overbought market, consolidation, trend reversal, trap at the level where traders and bearish robbers are stronger. 🏆💸"Take profit and treat yourself, traders. You deserve it!💪🏆🎉
Entry 📈 : "The vault is wide open! Swipe the Bullish loot at any price - the heist is on!
however I advise to Place buy limit orders within a 15 or 30 minute timeframe most recent or swing, low or high level. I Highly recommended you to put alert in your chart.
Stop Loss 🛑:
Thief SL placed at the Nearest / Swing low level Using the 3H timeframe (39200) Day/Swing trade basis.
SL is based on your risk of the trade, lot size and how many multiple orders you have to take.
🏴☠️Target 🎯: 42400
💰💵💸"US30/DJI" Index Money Heist Plan is currently experiencing a bullishness,., driven by several key factors. .☝☝☝
📰🗞️Get & Read the Fundamental, Macro Economics, COT Report, Geopolitical and News Analysis, Sentimental Outlook, Intermarket Analysis, Index-Specific Analysis, Future trend targets with Overall outlook score... go ahead to check 👉👉👉🔗🔗🌎🌏🗺
⚠️Trading Alert : News Releases and Position Management 📰🗞️🚫🚏
As a reminder, news releases can have a significant impact on market prices and volatility. To minimize potential losses and protect your running positions,
we recommend the following:
Avoid taking new trades during news releases
Use trailing stop-loss orders to protect your running positions and lock in profits
💖Supporting our robbery plan 💥Hit the Boost Button💥 will enable us to effortlessly make and steal money 💰💵. Boost the strength of our robbery team. Every day in this market make money with ease by using the Thief Trading Style.🏆💪🤝❤️🎉🚀
I'll see you soon with another heist plan, so stay tuned 🤑🐱👤🤗🤩

DowJones INTRADAY NFP volatility trigger! Momentum is bullish, but today’s NFP report is a key risk event. A weaker-than-expected jobs number could reinforce rate cut bets and extend the rally. A surprise beat may trigger profit-taking.
Key Support and Resistance Levels
Resistance Level 1: 41200
Resistance Level 2: 42000
Resistance Level 3: 42710
Support Level 1: 39446
Support Level 2: 38490
Support Level 3: 37840
This communication is for informational purposes only and should not be viewed as any form of recommendation as to a particular course of action or as investment advice. It is not intended as an offer or solicitation for the purchase or sale of any financial instrument or as an official confirmation of any transaction. Opinions, estimates and assumptions expressed herein are made as of the date of this communication and are subject to change without notice. This communication has been prepared based upon information, including market prices, data and other information, believed to be reliable; however, Trade Nation does not warrant its completeness or accuracy. All market prices and market data contained in or attached to this communication are indicative and subject to change without notice.

US30 - AnalysisKey Levels to look for:
Resistance - 41250
Support - 40800
Currently price show a neutral trend. Resistance level must be broken for a bullish outlook as long as support is respected. A double top formation near resistance level. Failure to break this level will result in retest of support level.
