VERASITY Bearmarket Structure could fully play out.Calling this now, let's see how it plays out.
The past is clearly indicating a breakdown like this to build a new strong 1-2 Setup for a nice recovery.
Potential returns from the targets to next tops in 2024/2025 will be 15X plus.
Have a nice day.
VRAUSDT.P trade ideas

$VRA breaking the resistance and aiming to $0.028There is a resistance that #VRA is trying to break in a matters of hours, if it breaks up then the target is the top of the resistance of the triangle, around $0.028/0.029.
I see in my opinion #VRA touching it an going back to $0.022/0.023 area before to break the triangle and have mayor targets such as $0.7/0.8.

Start Accumulating VRA Now. The best time to accumulate Verasity (VRA) begins now (if you believe in the project).
Please refer to the two bottom zones (anything under 0.25 really and the lower the better ofc) will be your best opportunity to accumulate VRA before the next run. Smart money comes in now. They also have staking rewards on their website so if we have to wait a year or two for the next bull run, we will be compounding our returns.
Risk Warning: This is only if the project continues to grow its community and stays strong. Always a risk with low market cap coins. However, if all goes well I think this is a terrific opportunity for some exceptional gains.


VRA PredictionHere is an update to the chart I posted a couple months ago. I have pushed my time line of .20 - .30 back until Late July early August now.

VRAUSDT For long term , investing
its target the blue areas on the charts .
The red areas for short term and trading.
I think you can buy from now then from first blue area if it down and from red if it down more .
making risk management is very important .
good luck

$VRA Possible 4950% Profit in less than a year$VRA as we can see the first bull wave started in 19/11/2020. It reached the top of its wave around April 2021.
Currently its correcting upward and we might see a bullish move that must start before June 6th 2022. if it doesn't then this analysis fails.
Buy at any price today. and from Gann we can see that 540 is around 0.935$
$VRA
Buy Price Range: 0.018-0.025
Target 1: 0.242$
Target 2: 0.93$

VRA on track to break support level Support level:
Currently trading just above a strong support level.
Ichimoku cloud:
Vra is currently trading below a red cloud indicating only short positions should be taken. The conversion and base line is showing no sign of a swift change in momentum. The lagging span is still currently below the price indicating further bearish sentiment.
Bearish pennant:
Price had a sharp downtrend creating the flag pole of the pennant. Vra currently seems to be trading in a triangle which finishes off the pennant.
Macd:
Shows weak bullish sentiment as bulls fail to drive up price.
Swing trade analysis:
Entering a trade on the bullish side right now would be extremely risky do to recent high volume in selling. Personally, I would enter a trade short if there is a break in the bearish pennant to the downside past the support level ( entrance would be at support). A stop loss would be set at .025 to mitigate risk and loss if the trade happens to go the other way.

VRA - MAAN its triangle with A@EHuuuge accumulation
High volume in this area, weekly macd almost crossing.

🆓Verasity (VRA) Apr-07 #VRA $VRA
VRA is having 2 strong support zones of this uptrend at $0.024 and $0.022, the current selling force is still not a concern with the real uptrend of VRA. Therefore, VRA can still continue its uptrend to the $0.036 and $0.044 zones this April.
📈RED PLAN
♻️Condition : If 1-Day closes ABOVE 0.022$ zone
🔴Buy : 0.024 - 0.022
🔴Sell : 0.03 - 0.036 - 0.044
📉BLUE PLAN
♻️Condition : If 1-Day closes BELOW 0.022$ zone
🔵Sell : 0.022
🔵Buy : 0.019 - 0.016
❓Details
📈Red Arrow : Main Direction as RED PLAN
📉Blue Arrow : Back-Up Direction as BLUE PLAN
🟩Green zone : Support zone as BUY section
🟥Red zone : Resistance zone as SELL section

$VRAUSDT very close to break out from here - $VRA $BTC$VRAUSDT very close to break out from here - $VRA $BTC
it at resistance , looking good for a break out from this range

Bullsing long term setup for VRAWhen you look at the $VRA pattern on the weekly it looks surprisingly good, Extending the earlier weekly uptrend to this (just started uptrend) then Q2 seems to be pretty green.

$VRA Swing Long Set Up Cup & Handle$VRA is currently making a cup and handle formation which is usually a bullish indication of price movement to the upward side. It has bounced from the 0.618 fib level as most charts do before they bullish momentum to the upward side.
Targets for this long setup are the green fib levels.

VRA will take you to the Moon!You can buy VRA from 0.248 to its current price (around 0.038), In my idea bitcoin and crypto market could have another correction to complete their bearish cycle, so if you put order to buy VRA in 4 steps, your average buying price could be at about 0.03
it is so worthy to hold (hodl :) ) VRA in your wallet
Sign up to its website and watch videos to earn money!

VRA in Short-TermScenario 1: If it wants to have correction then you can put your buy order somewhere between 0.021 to 0.0255 and another buy order on 0.0189. if you like you can have another buy other on 0.0155. it is most probable scenario.
Scenario 2: If it wants to break 0.033 resistance without going down, then you can enter it after pullback on 0.031 to 0.033

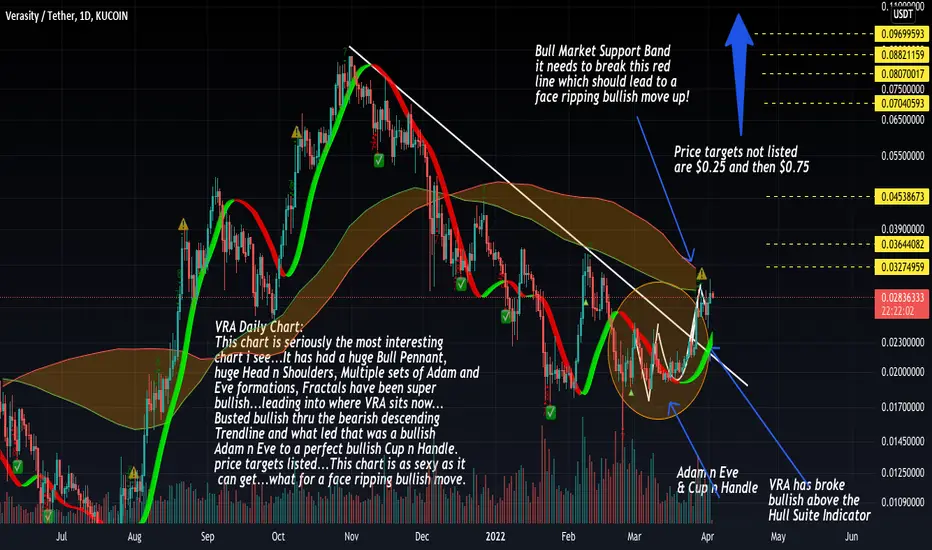
VRA daily chart is going to RIP your face offVRA Daily Chart:
This chart is seriously the most interesting
chart i see...It has had a huge Bull Pennant,
huge Head n Shoulders, Multiple sets of Adam and
Eve formations, Fractals have been super
bullish...leading into where VRA sits now...
Busted bullish thru the bearish descending
Trendline and what led that was a bullish
Adam n Eve to a perfect bullish Cup n Handle.
price targets listed...This chart is as sexy as it
can get...what for a face ripping bullish move.
VRA breakout?I see a bullish pennant forming on the 15-30 min chart, which looks like we might be seeing a nice breakout to to the upside.
I could see this going to 0.0325-0.035 zone within a day or two possibly a nice set up
Volume is also very large (almost 1 billion) and the market cap is still under $500 million
leaves me to think that we might see a lot of money pouring in IMO
*NOT FINANCIAL ADVICE*
Anti-Hedge

VRA #longBreaking the trend line
spot position (#long)
Tp1: 0.0248
Crossing TP1:
Tp2: 0.031
Tp3: 0.34
SL: Return below the trend line (1D)

VRA/USDT Aiming 70% gain mappedHello Traders
VRA/USDT has broken symmetrical triangle and confirmed above it.
In this scenario VRA can reach 0.05 $ so that's actually going to be a 70% gain.
Since market is a little bullish due to BTC gains , most likely continuing upward momentum is probable.
Stay Safe
Thanks for Reading
-RC

VRA bullish hoping for a 30% gainVRA is showing a falling wedge and is looking to go up 30% if the market stays bullish

$VRA 310322Verasity daily chart. Orange line is key no monthly close below since February 2021. Flipping to support on weekly/monthly=super bullish.

Verasity VRA price movement prediction Price movement prediction
not financial advise
for entertainment only
make sure to like and follow

