VRA - I'm averaging in on each dipHope everyone had a good holiday break.
Pretty much watching BTC as both VRA and BTC's charts are highly correlated.
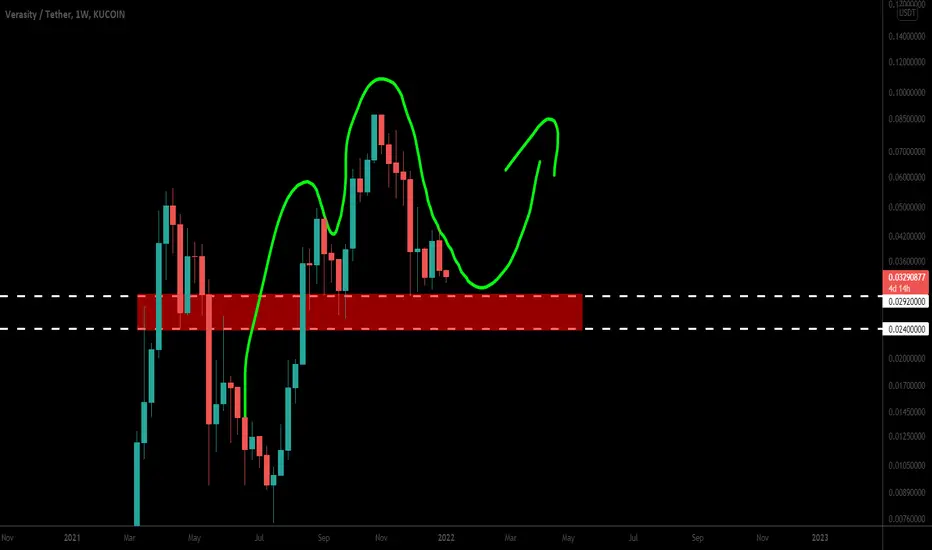
We're at support and I would not like to see us start trading below the wicks from September on higher TFs, if so, I will probably exit into Stables and wait and see.
I think both BTC and VRA have one more sweep of the lows left to take out September lows where there is a lot of long liquidity then pump to take out short liquidity.
Either we do it soon, or we bounce and do a slow grind down into it like we saw in June/July bottom on BTC.
Good luck.
VRAUSDT.P trade ideas

vra 3d : 0.0026 is end Ccorrection wave
hope it can end. with abc wave, vra can end of correction for new up


VRA-USDT; what would happen in mid-termI shared my TA before when the price was at the top of the channel and told you that we will see a major correction from there.
Now, here we are, experiencing almost 65% correction. The channel's midline couldn't act as a support to hold the price and now the next support is Fib. 0.786 level.
However, I think this Fib. level cannot hold the price too and we will probably see the price will test the bottom of the channel.
But what is important here is that the last swing low level on the weekly chart (the white arrow) is around $0.0254, just above the Fib. 0.786 level. If the price closes below this level, the long-term bullish structure is invalidated and we would see more downtrend.
Anyway, I will start buying around the Fib.0.88 level which is the bottom of the channel too.
Let me know your idea in the comments and let's learn and trade together!
Cheers!
Mr. CryptoTracker

VERASITY IS GETTING WELL ACCUMULATED FOR NEXT PUMPHi friends hope you are well and welcome to the new update on Verasity ( VRA )
Strong support and EMA resistance:
On a weekly time frame, VRA is bounced well by the support zone from $0.029 to $0.024. Now there is a resistance of exponential moving average 21. Once priceline breaks EMA 21 weekly then it will become a strong support and VRA can start another big move for long-term
Oscillators:
On weekly time frame RSI is moving below but very close to 50 value. It can be observed, that whenever RSI crosses up 50 level then VRA starts big move towards the upside. The Stochastic is also oversold and indicating that from here we can expect another reversal soon.
Note: Above idea is for educational purpose only. It is advised to diversify and strictly follow the stop loss, and don't get stuck with trade
Triple bottomTriple bottom is a bullish pattern.
Looking for a move to the upside soon.
Manage risk, set a tight stop loss.
Not financial advice

$VRA 05/01/2022$VRA
05/01/2022
Strong trendline recovery from before the dip
End of pullback in the coming week
oversold area
-->
A lot of momentum to create to the upside to eventually create a new trendline

VRA/USDT TA Update ( Cup& Handle Pattern still worked..? )#VRA/USDT Update:-
Hope you enjoyed my $VRA call.
That time Our All entries filled and Went upto $0.0874
Its almost 240% Profit from entry.
Now..?
As Per Chart very near to 100% Retracement.
Now at current scenario if hold Red Line support then we can see again 5x-10x from here.
But need to hold $0.03
What if break $0.03 support..?
If break $0.03 support then we can see $0.02-$0.025 which will best entry for Buy $VRA
Never do Gambling guys
Strong Resistance = $0.05
Strong Support = $0.021
If Break $0.05 Strong Support then we can see $0.2 ans $0.3 also.


VRA HTF ANALYSISIDEAS
VRA has had 2 good main runs so far.
Just entering the support zone now.
Strong support area and looking for confirmation of support on the RSI
Hopefully we will see support at the
white line (50 MA) with possibly a wick down
to the 0.786 fib level where I would scale in.
Should the building H&S pattern be broken to the downside I would definitely expect a stronger revisit of the 0.786 fib and should that be lost a further test of the bull market trend line,
confluent with the bottom BB
Comments welcome here to learn :D

VRA short head and shoulders pattern.BIG and obvious head and shoulders on the daily frame.
this coin gave 39,000% in 600 days and there are big FOMO on it at the moment so i think it will rest. anyway pattern fails if we breakout the two red lines. second one for safety.

VRA V Shape Recovery / Inverse Head & Shoulders VRA V Shape Recovery / Inverse Head & Shoulders VRA V Shape Recovery / Inverse Head & Shoulders VRA V Shape Recovery / Inverse Head & Shoulders


VRA LongWith the "crypto euphoria", VRA is one of the coins that has a stable technical chart pattern.

two scenarios for the weekend just waiting on my buy signal nottwo scenarios that might play out by this weekend for vra for now just waiting on my buy signal

VRA/USDT to the moonVRAUSDT trend line analysis. this pair will be in the moon before the end of the feb. Then it will start the bear market. let's see with future fundamentals of the coins. good luck to all.

vrausdt vrausdt is moving in a descending channel and probably it could come to 0.023 as it has not been retested if it comes to this area it can be a good buy .one of the coin to hold for long term .still not listed on pancake and binance. This is gem for long term hold .
NFA DYOR

VRAUSDTVarsity very good project my favorite future hope it will hit 1$ my chart is weekly it will take time.
now the price is between ( 0.036 - 0.03 )
after crossing below 0.02 daily I will close is we will se after that.
may we not see this number again
good luck send it.

#VRA USDT 4h if u want be worth ...vra have good condition for long time check it :) do not remember follow me and like this photo

It Will Be Another Massive Reversal Of Verasity (VRA)Hi friends hope you are well, and welcome to the new update on Verasity (VRA)
Broke out the channel:
On a daily time frame the priceline of VRA was moving in a down channel for more than a month. After testing the strong support zone ($0.024 to $0.029) finally Verasit broke out this channel.
Strong support zone:
If we zoon out to the weekly time frame, then it can be observed that this support zone which starts from $0.024 and goes to $0.029 is not broken down since Aug 2021.
weekly oscillator:
Stochastic oscillator on the weekly time frame is showing that the market of VRA has been oversold. Previously when the stochastic was oversold then we had a big move, now we can expect the same move again.
Note: Above idea is for educational purpose only. It is advised to diversify and strictly follow the stop loss, and don't get stuck with trade

VRA printing hidden bullish divergence on the 4hr VRA looking like its trying to break resistance. Also printing steep hidden bullish divergence. Ideally, this indicator helps push VRA above this ~0.042 range

CRYPTO - VRA - Accumulation finished. Another sign of strength.CRYPTO - VRA - Wyckoff Accumulation finished. Another sign of strength after a long accumulation. Green volume candles are taking over. RSI is rising. STO has bottomed and indicates a bounce. Computers says BUY.
Volume. Volume dominating on green bars.
RSI - Selling strength weaker on new higher lows.
STO - Bottomed out time to head back up.
Price = 0.0396
Target 1 = 0.05.
Stop loss = 0.034

Will Verasity VRA break the important RSI resistance?Will Verasity VRA break the important RSI resistance?
And that by flipping the 2-day MA Ribbon bullish?
Time for decision - what do you think? 😎
Drop me a nice comment if you'd like me to analyze any other cryptocurrency or do another comparison.
*not financial advice
do your own research before investing
