Hanzo | Nas100 15 min Bullish Break– Confirming the Next Move🆚 Nas100 – Hanzo’s Strike Setup
🔥 Timeframe: 15-Minute (15M)
——————
💯 Main Focus: Bullish Breakout at 19575
We are watching this zone closely.
📌 If price breaks with high volume, it confirms Smart Money is in control, and a strong move may follow.
———
Analysis
👌 Market Signs (15M TF):
• Liquidity Grab + CHoCH at 19460
• Liquidity Grab + CHoCH at 19000
• Strong Rejections seen at:
➗ 19100 – Major support / Key level
➗ 19450 – Proven resistance
🩸 Key Zones to Watch:
• 19450 – 🔥 Bullish breakout level X 3 Swing Retest
• 19460 – Strong resistance (tested 5 times)
• 19100 – Equal lows
• 19500 – Equal highs
Hanzo | Nas100 15 min Breaks – Will Confirm the Next Move
USTECH100CFD trade ideas

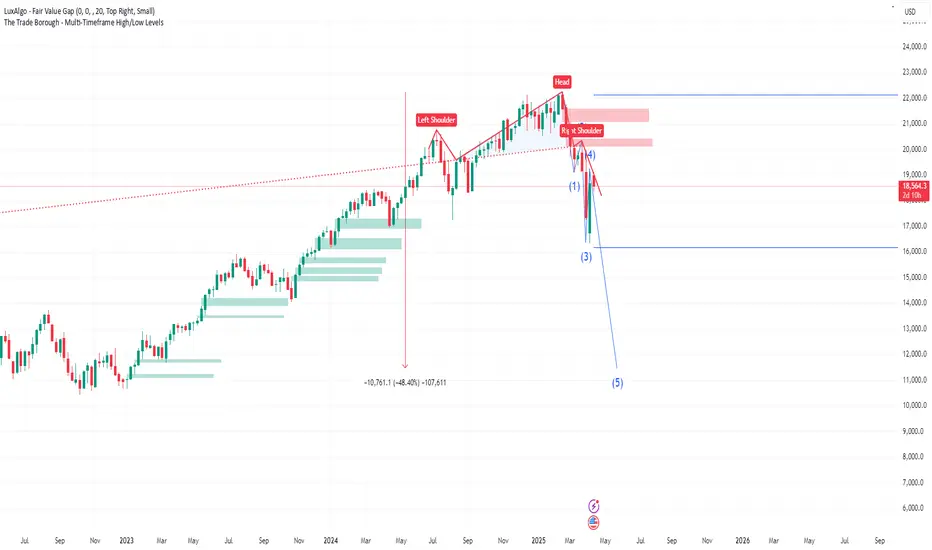
No shampoo in sight.....and an $11k Nasdaq?This posts presents an idea that has no precedence (that I can recall at least), so this is by definition a crazy idea BUT the chart is showing signs of extreme exhaustion and is possibly and quite frankly on the verge of a potentially destructive collapse.
If the recent severe volatility hasn't peaked your attention... this chart should.
It's quite simple...we have a MONSTER Head and Shoulders pattern on the Weekly TF...and we're finishing off the Right Shoulder! From a chart pattern perspective, this is ultra-ultra bearish.
The confluence we have is the Elliot Wave showing the we could be about to enter Wave 5. Elliot Waves are of course subjective BUT in this case its syncs with the Head and Shoulders.
If this was a 15min chart, most would probably agree hands down, but this is a Weekly Chart and represents Trillions on Trillions so its hard to believe that this could even be a possibility.....but I believe it could happen!
The horizontal blue lines provide 2024's High and Low Price. For this disaster scenario to be avoided, the Bulls and anyone who cares must defend 2024's low around 16100. This must not be breached, to keep the 12M bullish structure in place.
The green shaded areas highlight all of the Buy Side fair value gaps on the WEEKLY TF going back to early January 2023!
Could the market dive for these in devastating fashion? Only time will tell.
In the interim, we should trade safe and manage risk as best as we can.

Demand Zone US100 (Potential Long Play) Next week there is a nice opportunity on an identified demand zone on the US100. Due to bullish market Structure, We aim for long positions on demand zones as these are higher probabilities plays than shorts. The demand zone area is the last bearish candle (without upper wick), marked on the 1HR time frame and will be the key area of interest.

Hanzo | Nas100 15 min Breaks – Will Confirm the Next Move🆚 Nas100 – Hanzo’s Strike Setup
🔥 Timeframe: 15-Minute (15M)
——————
💯 Main Focus: Bullish Breakout at 19450
We are watching this zone closely.
💯 Main Focus: Bearish Breakout at 19300
We are watching this zone closely.
📌 If price breaks with high volume, it confirms Smart Money is in control, and a strong move may follow.
———
Analysis
👌 Market Signs (15M TF):
• Liquidity Grab + CHoCH at 19460
• Liquidity Grab + CHoCH at 19000
• Strong Rejections seen at:
➗ 19100 – Major support / Key level
➗ 19450 – Proven resistance
🩸 Key Zones to Watch:
• 19450 – 🔥 Bullish breakout level X 3 Swing Retest
• 19460 – Strong resistance (tested 5 times)
• 19100 – Equal lows
• 19500 – Equal highs

X2: NQ/US100/NAS100 Short - Day Trades 1:2 RRX2:
Risking 1% to make 2%
NAS100, US100, NQ, NASDAQ Short for day trade, with my back testing of this strategy, it hits multiple possible take profits, manage your position accordingly.
Risking 1% to make 2%
Use proper risk management
Looks like good trade.
Lets monitor.
Use proper risk management.
Disclaimer: only idea, not advice

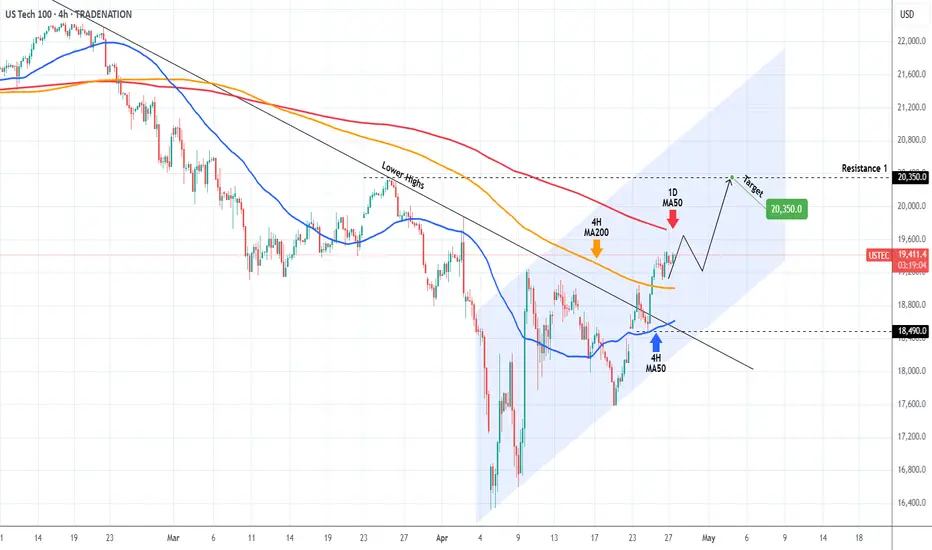
NASDAQ ahead of the most critical Resistance test.Nasdaq (NDX) not only broke above the Lower Highs trend-line of its All Time High (ATH) last week but managed to break and turn the 4H MA200 (orange trend-line) into Support.
It is now aiming for the 1D MA50 (red trend-line), which is the most crucial Resistance level of this recovery attempt and is what technically turns bearish trends into bullish if it turns into Support.
We expect a short-term rejection there, which should give a buy opportunity near the 4H MA200. Our Target for this is 20350 (Resistance 1).
-------------------------------------------------------------------------------
** Please LIKE 👍, FOLLOW ✅, SHARE 🙌 and COMMENT ✍ if you enjoy this idea! Also share your ideas and charts in the comments section below! This is best way to keep it relevant, support us, keep the content here free and allow the idea to reach as many people as possible. **
-------------------------------------------------------------------------------
Disclosure: I am part of Trade Nation's Influencer program and receive a monthly fee for using their TradingView charts in my analysis.
💸💸💸💸💸💸
👇 👇 👇 👇 👇 👇
NSDQ100 INTRADAY trend change supported at 18950 Key Support and Resistance Levels
Resistance Level 1: 19590
Resistance Level 2: 20070
Resistance Level 3: 20344
Support Level 1: 18460
Support Level 2: 17820
Support Level 3: 17330
This communication is for informational purposes only and should not be viewed as any form of recommendation as to a particular course of action or as investment advice. It is not intended as an offer or solicitation for the purchase or sale of any financial instrument or as an official confirmation of any transaction. Opinions, estimates and assumptions expressed herein are made as of the date of this communication and are subject to change without notice. This communication has been prepared based upon information, including market prices, data and other information, believed to be reliable; however, Trade Nation does not warrant its completeness or accuracy. All market prices and market data contained in or attached to this communication are indicative and subject to change without notice.

Gold Vs. Nasdaq, since 2017 Using momentum indicators, the Nasdaq is overbought and seems to be retreating a bit off of that region. Gold is continuing to move into the overbought region of momentum.
The two are following more of a correlation up until now. This current movement marks divergence, which is what is expected. This coincides with the expectation that Gold and equities will trend in opposite directions.
In other research, it is noted that when there is correlation followed by divergence, it is typically the equity which was over-extended and will retrace back against Gold's more gradual movement. Gold typically keeps pace with inflation.

NAS100 Trendline Break: Short-Term Rally or Another Trump Shock?NASDAQ breaks above its trendline, hinting at a possible short-term rally toward previous consolidation levels — but political volatility could still slam the brakes without warning.

NQ: Crumbs left to the upsideGood day!
Following the weekly analysis, here are possible movements for the next few sessions.
As I mentioned few times now, there is still small room left to the upside followed by a consolidation before resuming the down trend with the beginning of Wave 3 and its Initial Swing.
Price has already made a new HH. Price might continue up without making a new HL. But I see a HL first. GL!

NAS100 SELLGiven the resistance levels and the hidden divergence, it returned to the previous support level.

Watch this meltFirst time publishing i might be wrong but we'll see :) my thoughts here on a hard short

NAS100 Bulls Rally – Eyes on 19,860 Resistance Zone!"The NAS100 is sustaining a strong bullish rally after reclaiming the 19,150 🔽 support zone. Price is trading firmly within a bullish structure, but still has some distance to reach the next key resistance at 19,860 🔼.
Currently trading at 19,446, with
Support at: 19,150 🔽, 18,500 🔽, 17,600 🔽
Resistance at: 19,860 🔼, 20,347 🔼
Bias:
🔼 Bullish: As long as price holds above 19,150, bulls remain in control. A breakout and retest above 19,860 could fuel a further move toward 20,347.
🔽 Bearish: A rejection from 19,860 or a break below 19,150 could trigger a decline toward 18,500.
No breakout, no trade.
📛 Disclaimer: This is not financial advice. Trade at your own risk.

When the trade gives you much more than you believed was possiblStick to the plan on this one and enjoy! Doubled the move but that should have been expected since we are reaching the outer levels of price expansion.

US100 - Corrective Pullback into FVG + Golden Pocket setup?This 1H Nasdaq chart paints a classic structure of retracement within a bullish leg, offering potential for continuation after a clean corrective move into inefficiency. It's all about balance restoration before the next impulse.
---
1. Resistance Reaction & Local Distribution
Price faced strong rejection at a clearly defined Resistance Zone , marking a point of supply where sellers stepped in with aggression.
- The sharp rejection indicates profit-taking from earlier longs or a short-term distribution zone.
- Structure is transitioning from impulsive to corrective, suggesting a pullback is unfolding rather than a trend reversal (at least for now).
---
2. Short-Term Demand Zone Holding Price (Gray Box)
Before reaching deeper liquidity, price is hovering above a local demand block —a previously unmitigated consolidation that supported the last push up.
- This gray zone may provide temporary support, but lacks depth of imbalance.
- It's a weak floor, and smart money typically seeks deeper fills for proper re-accumulation.
---
3. Fair Value Gap Below (Primary Draw on Liquidity)
The key area of interest lies just below, where a clean Fair Value Gap (FVG) is formed. This imbalance represents a void in price action where buy-side inefficiency remains.
- Aligned with the 0.618–0.65 Fibonacci retracement range (confluence entry).
- Price is likely to seek this inefficiency for proper rebalancing.
- It’s not just a “fill the gap” play—it’s a liquidity grab where smart money is most likely waiting.
This zone is ideal for reaccumulation before resuming the move higher.
---
4. Internal Structure Suggests Bullish Intent After Fill
Price is forecasted to:
- Step 1: Break beneath the short-term demand to draw in liquidity
- Step 2: Tag the FVG zone, tapping into fresh demand
- Step 3: Shift structure via higher low formation and breakout
This is the behavior of an engineered retracement—not panic selling.
---
5. Macro Bias Still Bullish – Controlled Pullback
While the short-term price action looks bearish, the context remains supportive of upward continuation:
- No signs of aggressive selling below structure
- Current flow is corrective, not distributive
- FVG zone is strategically placed in alignment with optimal trade entry levels (OTE)
If this zone holds, expect a return to bullish expansion targeting inefficiencies left behind on the push down.
---
Conclusion:
This setup is textbook:
- Efficient rejection at resistance
- Controlled retracement into FVG with Fibonacci confluence
- Potential structural shift post-rebalance
Watch for bullish intent to return once the imbalance is filled. Until then, this is not a breakdown—it's a setup.

Hanzo | Nas100 15 min Breaks – Will Confirm the Next Move🆚 Nas100 – Hanzo’s Strike Setup
🔥 Timeframe: 15-Minute (15M)
——————
💯 Main Focus: Bullish Breakout at 19550
We are watching this zone closely.
💯 Main Focus: Bearish Breakout at 19450
We are watching this zone closely.
📌 If price breaks with high volume, it confirms Smart Money is in control, and a strong move may follow.
———
Analysis
👌 Market Signs (15M TF):
• Liquidity Grab + CHoCH at 19460
• Liquidity Grab + CHoCH at 19000
• Strong Rejections seen at:
➗ 19100 – Major support / Key level
➗ 19450 – Proven resistance
🩸 Key Zones to Watch:
• 19450 – 🔥 Bullish breakout level X 3 Swing Retest
• 19460 – Strong resistance (tested 5 times)
• 19100 – Equal lows
• 19500 – Equal highs
Hanzo | Nas100 15 min Breaks – Will Confirm the Next Move

NASDAQ MEGA BOUNCE ZONEI want to see a super bounce from this demand zone tomorrow due to the recent reactions around this price level. Lots of interest being shown here. I am sized in pretty heftily on MNQ futures. In a $0 or HERO position. WIll be closing my laptop now...

EMA 60 capped the NASDAQ rallyThe NASDAQ’s rally was capped by the 60-day EMA, as ongoing tariff wars and the Federal Reserve’s reluctance to cut rates-or its intention to keep rates elevated for as long as possible-continue to weigh on investor sentiment. Given these headwinds, there is a risk that the NASDAQ may continue to slump.

Are You Ready For Nasdaq Next Flight ? 500 Pips Waiting For Us !Here is my opinion on Nasdaq , i think we have a very good closure and we can say we will go up for sometime in the next few days , so i`m waiting the price to go back to my support area ( Lower One ) that already broken , and then we can enter a buy trade and targeting 500 pips . also if the price touch the higher place and give me a good bullish price action , we can enter a buy trade with small lot size and if the price go to the lower one we can add one more contract .

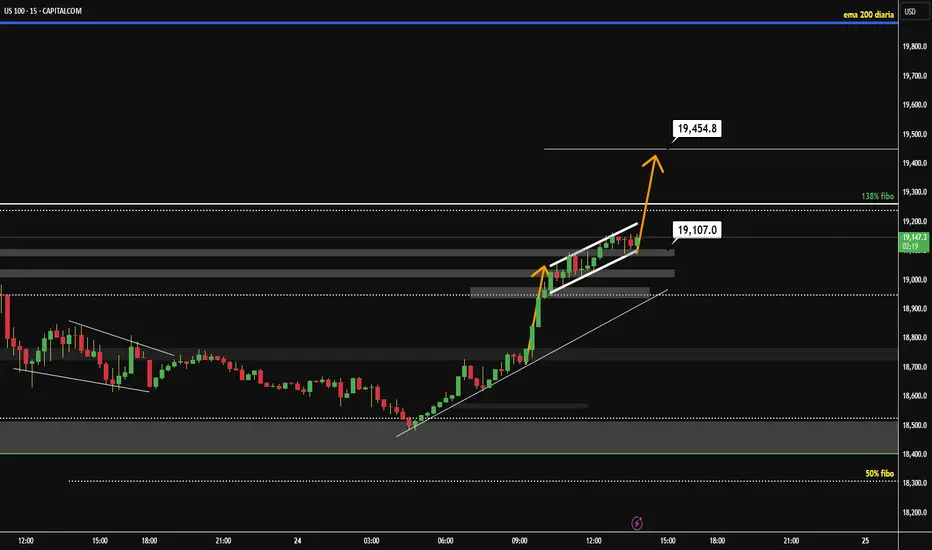
Bullish Continuation Setup Towards📈 US100 - Bullish Continuation Setup Towards 19,454.8 🚀
After a strong impulsive move, US100 is consolidating inside a rising channel, forming a classic bull flag structure. Price has respected multiple demand zones on the way up and currently sits just above the key support at 19,107.0. The bullish momentum is supported by a clean structure of higher highs and higher lows, and a breakout from the flag could trigger the next leg up toward the 138% Fibonacci extension level at 19,454.8.
As long as price holds above the 19,000–19,107 support zone, this scenario remains valid. Keep an eye on volume and a breakout candle for confirmation. 📊💥
Potential bullish rise?USTEC has reacted off the pivot and could rise to the overlap resistance.
Pivot: 18,950.55
1st Support: 18,467.08
1st Resistance: 20,258.77
1st Resistance: 34.50
Risk Warning:
Trading Forex and CFDs carries a high level of risk to your capital and you should only trade with money you can afford to lose. Trading Forex and CFDs may not be suitable for all investors, so please ensure that you fully understand the risks involved and seek independent advice if necessary.
Disclaimer:
The above opinions given constitute general market commentary, and do not constitute the opinion or advice of IC Markets or any form of personal or investment advice.
Any opinions, news, research, analyses, prices, other information, or links to third-party sites contained on this website are provided on an "as-is" basis, are intended only to be informative, is not an advice nor a recommendation, nor research, or a record of our trading prices, or an offer of, or solicitation for a transaction in any financial instrument and thus should not be treated as such. The information provided does not involve any specific investment objectives, financial situation and needs of any specific person who may receive it. Please be aware, that past performance is not a reliable indicator of future performance and/or results. Past Performance or Forward-looking scenarios based upon the reasonable beliefs of the third-party provider are not a guarantee of future performance. Actual results may differ materially from those anticipated in forward-looking or past performance statements. IC Markets makes no representation or warranty and assumes no liability as to the accuracy or completeness of the information provided, nor any loss arising from any investment based on a recommendation, forecast or any information supplied by any third-party.

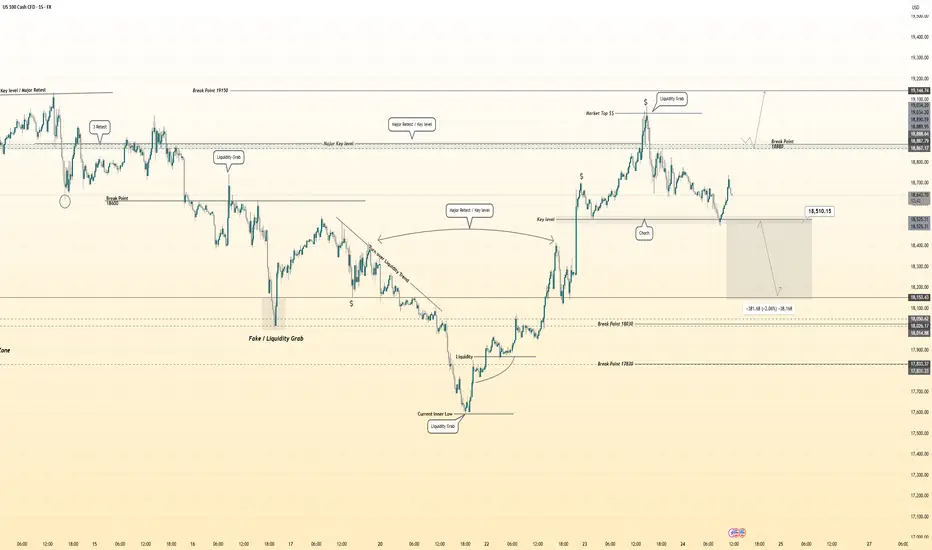
Hanzo | Nas100 15 min Breaks – Will Confirm the Next Move🆚 Nas100 – Hanzo’s Strike Setup
🔥 Timeframe: 15-Minute (15M)
——————
💯 Main Focus: Bullish Breakout at 18880
We are watching this zone closely.
💯 Main Focus: Bearish Breakout at 18510
We are watching this zone closely.
📌 If price breaks with high volume, it confirms Smart Money is in control, and a strong move may follow.
———
Analysis
👌 Market Signs (15M TF):
• Liquidity Grab + CHoCH at 19050
• Liquidity Grab + CHoCH at 18500
• Strong Rejections seen at:
➗ 18500 – Major support / Key level
➗ 18900 – Proven resistance
🩸 Key Zones to Watch:
• 18500 – 🔥 Bullish breakout level X 4 Swing Retest
• 18900 – Strong resistance (tested 6 times)
• 18500 – Equal lows
• 19050 – Equal highs
Hanzo | Nas100 15 min Breaks – Will Confirm the Next Move