QQQ FORECAST Q2 FY25: 13% RECOVERY APRIL FOOLSlike comment follow all the signals here are lit
comment your instrument below ill analyse it bonds crypto etf reits all dat paperwork
The recovery was swift exactly at our $16811 price level (great bargain) if you watched last call
now im calling bluff on this 90 day hype stop loss above entry targets set
there might be a bullish continuation by the mid point narrated by the path line
$17709 if confluence presents itself and necessary events present themselves im hopping out and longing these tariff games can go anyway in a heartbeat
USTECH100CFD trade ideas

US NAS100Preferably suitable for scalping and accurate as long as you watch carefully the price action with the drawn areas.
With your likes and comments, you give me enough energy to provide the best analysis on an ongoing basis.
And if you needed any analysis that was not on the page, you can ask me with a comment or a personal message.
Enjoy Trading ;)

Nasdaq has broken trendine with signs of reversal.Nasdaq has broken trendine with early signs of reversal.

NASDAQ Potential DownsidesHey Traders, in today's trading session we are monitoring NAS100 for a selling opportunity around 19,400 zone, NASDAQ is trading in a downtrend and currently is in a correction phase in which it is approaching the trend at 19400 support and resistance area.
Trade safe, Joe.

NDX - SHORT POSITIONGood Morning,
I have entered an SQQQ trade to short the NDX. Overall NDX has been in a mid-term bullish trend and continues to do so.
When the NDX shows signs of short, I typically sell my stocks that trend with it and enter an SQQQ.
ENJOY!


NasdaqIt came to major OB
Also we have a huge impulsive move, that’s why I expect the pullback
After pullback we can continue our movement to upwards


Trade Update Based on NASDAQ PredictionsThis is an update on my trade idea that I posted a few hours ago for NASDAQ. Made over $6,912 on all positions!

Current Analysis for NASDAQ I'm currently looking for short term sells for price to make a correction and fill the inefficiency. After that is completed, I'll be looking for Long term buys targeting the 19,233.9 level and afterwards I'll be targeting -27.0 percent level on the fibs.

Hanzo | Nas100 15 min Breaks – Will Confirm the Next Move🆚 Nas100 – Hanzo’s Strike Setup
🔥 Timeframe: 15-Minute (15M)
——————
💯 Main Focus: Bearish Breakout at 18700
We are watching this zone closely.
📌 If price breaks with high volume, it confirms Smart Money is in control, and a strong move may follow.
———
🔻 Every warrior needs a tribe.
Follow Hanzo. Support the path.
Analysis
👌 Bearish Signs (15M TF):
• Liquidity Grab + CHoCH at 18700
• Liquidity Grab + CHoCH at 18400
👌 The Market Has Spoken – Are You Ready to Strike?

Downtrend looks to be continuing with a new lower highAre we targeting a new lower low? Time will tell, but with every passing day the true nature of a sitting president full of hot air comes to light. The words that are spewed will have less and less gravity on the markets until his words are put out onto deaf ears and the markets can get back to a functioning state. When you hear a liar speak the first time you don't know the words are lies, but eventually you just stop listening to the nonsense because it all seems like lies after. Either way the words hold little punch. Shock and Shock is the ploy, I guess? I'm not shocked any longer and maybe the markets will get it too eventually.

NASDAQ (NDX) Market OutlookCurrently, the NASDAQ is trading around 19,723. We're anticipating a short-term pullback toward the 19,462 level, where a significant pool of liquidity awaits. This zone could act as a magnet for price in the near term. Once price reaches this area, we’ll closely monitor the lower timeframes for a potential bullish reaction or accumulation, which could signal the next leg higher.
Stay patient and let price confirm at key levels.

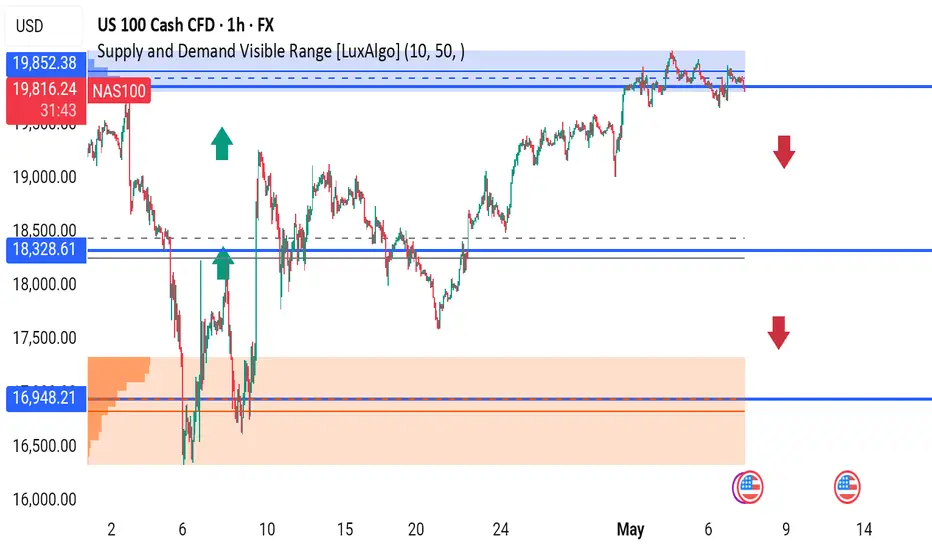
NAS100 1H | Major Rejection Zone – Time to Sell?NAS100 is trading inside a key supply zone, showing clear rejection signs near 19,825, with a potential downside move on the table.
Watch These Levels:
Resistance (Rejection Zone): 19,825
First Support: 18,328
Major Demand Zone: 16,948
Bearish Bias if price fails to break and close above 19,825.
A break below 18,328 could trigger a deeper drop toward 16,948.
Trade Plan:
Sell near 19,825 with SL above zone
Target 18,328 → 16,948
Bullish reversal only above clean breakout
What do you think—pullback or breakout?
#NAS100 #NASDAQ #Indices #PriceAction #SupplyAndDemand #SmartMoney #ForexTrading #TechnicalAnalysis #LuxAlgo #US100 #CFD
NSDQ100 INTRADAY awaits Fed Rate Decision Macro & Central Banks
The Federal Reserve is expected to keep interest rates unchanged. Officials say policy is well-positioned, despite political frustration.
China is adding stimulus: cutting rates, reducing bank reserve requirements, and increasing gold reserves for the sixth month in a row.
Markets
U.S. stock futures are higher.
The U.S. dollar is recovering after three days of declines.
The U.S. and China will restart trade talks — the first since the Trump-era tariff war.
Companies
Novo Nordisk shares are rising on expectations of less competition for its obesity drug Wegovy.
WeightWatchers has filed for bankruptcy.
Earnings reports this morning: Walt Disney, Uber, Barrick Gold.
Earnings reports this afternoon: Arm Holdings, Occidental Petroleum, Carvana, Flutter.
Key Support and Resistance Levels
Resistance Level 1: 20,190
Resistance Level 2: 20,510
Resistance Level 3: 20,930
Support Level 1: 19,330
Support Level 2: 19,020
Support Level 3: 18,570
This communication is for informational purposes only and should not be viewed as any form of recommendation as to a particular course of action or as investment advice. It is not intended as an offer or solicitation for the purchase or sale of any financial instrument or as an official confirmation of any transaction. Opinions, estimates and assumptions expressed herein are made as of the date of this communication and are subject to change without notice. This communication has been prepared based upon information, including market prices, data and other information, believed to be reliable; however, Trade Nation does not warrant its completeness or accuracy. All market prices and market data contained in or attached to this communication are indicative and subject to change without notice.

Understanding the Crab's Potential Ascent Before the DescentCurrent market analysis suggests a potential temporary surge in the Nasdaq index, colloquially referred to as a "crab walk," possibly reaching a level of 20.4 before a significant correction.
While this upward movement may present short-term opportunities, it is crucial to recognize its potential transience.

Technical Breakdown on US100 | 1H TimeframeHere’s a professional technical breakdown of the US100 Cash CFD (1H timeframe) using Volume Profile, Gann, and CVD + ADX indicators:
1. Key Observations (Volume, Gann & CVD + ADX Focused)
a) Volume Profile Insights:
Value Area High (VAH): 19,979.00
Value Area Low (VAL): 19,845.22
Point of Control (POC):
Recent POC: 19,979.52
Prior POC: 19,845.22
High-volume nodes: Clearly seen around 19,845 and 19,880–19,980, indicating buyer-seller equilibrium.
Low-volume gaps: Between 19,900–19,950 and below 19,800–19,700 — price can move fast through these zones.
b) Liquidity Zones:
Stops Likely Clustered:
Above 20,000 (psychological + prior swing high)
Below 19,800 (swing low and zone of previous rejection)
Absorption Zones:
Notable delta-based absorption occurred around 19,845 and 19,880 zones, indicating institutional activity.
c) Volume-Based Swing Highs/Lows:
Swing High (with spike): 19,980–20,000 (strong volume + reversal candle).
Swing Low (with spike): 19,845 zone, also aligns with historical POC, confirming strong defense.
d) CVD + ADX Indicator Analysis:
Trend Direction: Range-bound to Bearish bias
ADX Strength:
ADX is hovering near 20, not confirming a strong trend.
DI- > DI+ suggests slight downward pressure.
CVD Confirmation:
Flat to slightly falling CVD with price stalling = Supply is outweighing demand, slight bearish bias.
2. Support & Resistance Levels
a) Volume-Based Levels:
Support:
19,845.22 (POC + VAL)
19,800 (swing low and absorption)
Resistance:
19,979.52 (POC)
20,000 (psychological + rejection zone)
b) Gann-Based Levels:
Confirmed Swing High: 20,000
Confirmed Swing Low: 19,845
Key Retracements (From 19,845 to 20,000):
1/2: 19,922
1/3: 19,896
2/3: 19,969
3. Chart Patterns & Market Structure
a) Trend: Range-bound to Slightly Bearish
Price is stuck between 19,845–19,979 with no clear breakout or breakdown.
b) Notable Patterns:
Horizontal consolidation forming after a failed breakout near 20,000.
Bearish bias is developing with failure to hold above POC.
Watch for breakout from the descending triangle setup forming.
4. Trade Setup & Risk Management
a) Bullish Entry (Only if breakout above resistance):
Entry Zone: 19,985–20,000 (break + retest)
Targets:
T1: 20,100
T2: 20,300
Stop-Loss (SL): 19,940 (below breakout level)
RR: Minimum 1:2
b) Bearish Entry (If CVD + ADX confirm downtrend):
Entry Zone: 19,845–19,860 (retest of support failure)
Target:
T1: 19,700
Stop-Loss (SL): 19,980
RR: Minimum 1:2
c) Position Sizing: Risk 1–2% of capital per trade.

NQ: Prior to the FEDAs expected, NQ is consolidating.
Tomorrow is a big day in terms of looking forward. What should we expect from the FED?
1- FED Mandate is: Employment and Inflation
2- FED has always said: FED policy is data related.
The latest data on both Employment and Inflation were not sufficiently bad to rationalize the rate cuts and feed Trump's pressure.
Hence, I think the FED won't give any hint tomorrow about the rate cut on June. This will disappoint market and a Sell-off of stocks and equities will be massive. The start of Wave 3.
The other scenario will send stocks and equities up in a zigzag move: Down then up.
Gold as a lead indicator has resumed up its direction. This might be a sign of what is coming for equities.
Have a good evening/night!

The Nasdaq 100’s rally may be coming to an endThe Nasdaq 100 has staged an impressive rally over the past two weeks, climbing more than 12% since Monday 21 April to close at roughly 19,970 on Monday 5 May. However, if there were a point at which the advance might pause, it could be near current levels. The index has risen to a key area of technical resistance in the 19,900 to 20,200 range, which could prove challenging to break through, especially given the uncertain outlook.
One driver behind the Nasdaq 100’s rise has been the fall in implied volatility, as indicated by the VXN. While the better-known Vix measures expected volatility in the S&P 500 over the next month of trading, the VXN measures volatility on the Nasdaq 100. It has recently dropped to a reading of 25.7, down from more than 50 in April, as shown on the chart below. This decline in implied volatility probably triggered significant unwinding of put positions in the options market, allowing market-maker hedging flows to provide a tailwind for stocks. But with the VXN now back at levels last seen on 2 April, this tailwind may no longer be available to support the market.
Additionally, the Nasdaq 100 has returned to the 61.8% retracement level, a significant Fibonacci level that frequently acts as strong resistance and could help determine whether the recent rebound is genuine or merely a short-term blip. Just above this 61.8% retracement lies the 200-day moving average, another level that typically provides strong resistance. Furthermore, the 19,950 region has consistently acted as both support and resistance, dating back to June 2024. With these three resistance areas converging, it may be challenging for the tech-heavy index to sustain its upward momentum. Should stocks begin to reverse lower, initial support may be around 19,300, followed by a gap at 18,240.
That said, if the Nasdaq 100 somehow manages to overcome all these hurdles, it could rise to 21,100 – though such a move appears unlikely at this stage.
Written by Michael J. Kramer, founder of Mott Capital Management
Disclaimer: CMC Markets is an execution-only service provider. The material (whether or not it states any opinions) is for general information purposes only and does not take into account your personal circumstances or objectives. Nothing in this material is (or should be considered to be) financial, investment or other advice on which reliance should be placed.
No opinion given in the material constitutes a recommendation by CMC Markets or the author that any particular investment, security, transaction, or investment strategy is suitable for any specific person. The material has not been prepared in accordance with legal requirements designed to promote the independence of investment research. Although we are not specifically prevented from dealing before providing this material, we do not seek to take advantage of the material prior to its dissemination.

NAS - SLOWLY enter the long positionTeam, NAS time to buy slowly
We been waiting for the last two day
as we expect market will drop before RATE announcement
this is a good entry but buy slowly
if it drop to second box, double up.. the volume
Trade with confident.

NQ: Consolidation phaseWhile market is waiting for a clear hint from the FED or a concluded deals on tariffs, NQ has entered in a consolidation phase.

NAS100 1-8RR LONG Trade ideia.NAS100 1-8RR LONG Trade ideia. Once we see the brake of structure in 5min we can buy and hold for 1-8RR. Still the same setup I shared ealier.

Supply and demandA rally base drop... Market rally up and created a zone and drop breaking the previous structure creating a near perfect setup which has a zone that has not been tested and is aligned with higher time frame so market will drop when it gets to that zone
