Is It Over?Today's red Doji candle at the underside of the downtrend line is a high potential short entry point if not already. Despite the rally the past week or so, it is far from convincing...no real conviction to buy this market and who can blame them.
The current wave 2 bounce will be followed by wave 3 down as the most likely scenario, or we are in a wave 4 to be followed by a wave 5 to complete, any firm close below the lows gives us our answer.
Gold is selling off, our $3400 target was met and reversed in a now wave 4 down, this may approach the $3160 area, or a sideways move before another strong wave 5 up.
This is a great opportunity to accumulate physical metals to protect yourself from the coming reset.
Appreciate a thumbs up, Good Trading and God Bless you all!
WALLSTREETCFD trade ideas

Us30 longThis is a very short term trade..
1 is a wave of fear
2 is a wave of panic
3 is a wave of stop outs, (I was stopped out too)
after wave3 buyers come in hot
I would advise entering after break and retest of the trendline. to recent high

US30 shortWhat is a bear market?
A downward market with strong rallies. we are around a turn around area. Positive job data is just hysteria, false confidence.
>Momentum to the upside fading
>lower high on 5 mins
>countertrend!

DJI Lost over 73% in 16 years versus inflationFrom 1966 to 1982, holding on to U.S. stocks was a painful experience, especially once you factor in inflation.
But guess what thrived during that time?
Gold, silver, uranium, crude oil & friends.

US30 – Rejection from Supply Zone! Dow Heading Lower?Timeframe: 1H | Strategy: Supply & Demand + Price Action
The Dow Jones just tagged a key supply zone near 40,965 and printed a clean rejection candle — a potential signal that bulls are losing control.
Technical Outlook:
Supply Zone (Resistance): 40,965 – 41,020
Breakdown Point: Below 40,486 = possible short trigger
Demand Target Zone: 39,938 – 40,000 (orange block)
Observations:
Price attempted a breakout but was rejected at the top of the supply zone
A clean bearish candle has formed at resistance
Market sentiment may be shifting ahead of upcoming U.S. data (see icon)
Trade Idea (Bearish Bias):
Entry: Below 40,486
Target: 39,938
Stop Loss: Above 41,020
Watch for volume confirmation and retest of the breakdown level.
Invalidation:
If price closes above 41,020 on strong momentum, the bearish setup is off the table.
Fundamental Alert:
US data/events may trigger volatility soon — watch for fakeouts or sharp reversals.
Will the Dow retrace to the 40K zone, or is this a false sell signal? Drop your view below!
Like & follow for more clean price action setups!
#US30 #DowJones #PriceAction #SupplyAndDemand #LuxAlgo #TradingStrategy #TechnicalAnalysis #Indices #BearishReversal #TradingView

YM (US30): Trend in daily time framePlease pay special attention to the accurate trend, channels, and magic colored levels.
Its very sensitive setup, ...............<<<<<<<<<<<<<<<<<<<<<<<
Be careful
BEST
MT

Update on US302:1 RR hit ✅ Day is completed. I will now leave the market alone and go enjoy the rest of my day. I pray you too will have a blessed end of day and weekend Reflect on the week, Rest and Enjoy your time with your loved ones

Is everyone missing the leading diagonal Ive seen conflicting Elliot Wave Counts with both Bullish counts suggesting a new ATH is at hand as the decline is only a 3 wave decline and not five and bearish counts suggesting this is only a bear market rally since the Trump Tariff Tantrums.
However if we look at the decline as either a leading diagonal in a primary 4th Wave of an overall bull market or a leading diagonal which often occurs in reversal of trend from Bull to bear or vice versa.
What is not commonly recognized is that the C wave in these structures is often pronounced and extended.
If this count is correct the Dow has about 1000 points of upside before a very sharp decline in an E wave that will probably throw-over the lower trendline and find support in the 35000 area for a significant Wave 2 or B wave rally.
The typical characteristics of the e wave are sharp and deep.

Us30 longLong position from 41200. I think the 41400 region gets hit pretty soon.
If not tonight , tomorrow when stocks open i think she will start jumping higher.

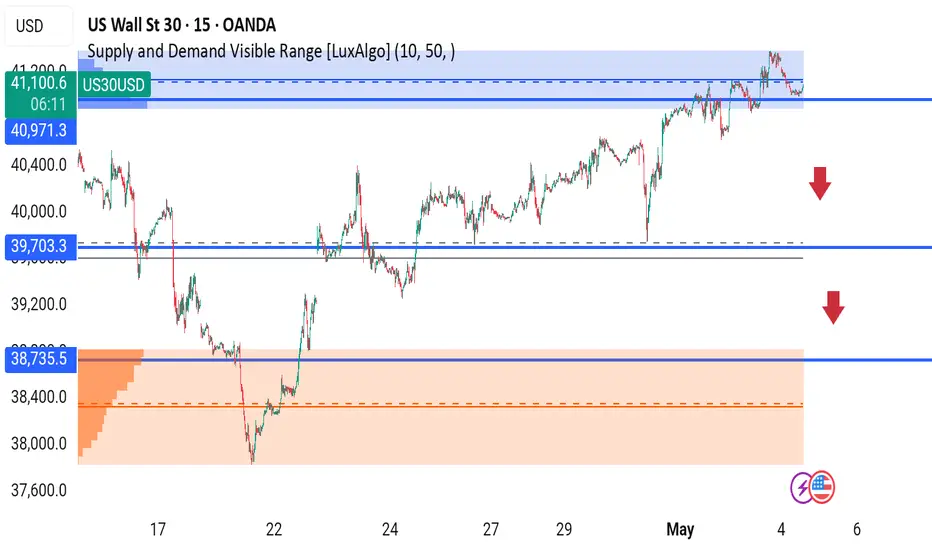
US30 – Key Supply Rejection at 41,000 | Is a Pullback ? The Dow Jones (US30) is currently trading at 41,089, slightly below the critical supply zone between 41,000 - 41,150, as identified by LuxAlgo’s Supply & Demand Visible Range. Price is showing signs of exhaustion after testing the top of the range, hinting at a potential short-term correction.
Chart Breakdown:
Supply Zone: 41,000 – 41,150 (visible resistance from recent price reaction).
Current Price: 41,089
First Support: 40,971 – the last breakout zone.
Next Support: 39,703 – major structure break level.
Demand Zone: 38,735 – 38,000 (bullish reversal zone, high volume node).
Bearish Scenario:
A clean break below 40,971 could confirm short-term bearish momentum.
Watch for price to fill the inefficiency gap toward 39,703 and possibly test 38,735 if weakness continues.
Red arrows on chart signal likely downside zones if buyers fail to defend higher levels.
Bullish Scenario:
Reclaim and close above 41,150 on strong volume may invalidate the bearish bias and push price to new highs.
Upcoming Volatility Alert:
Key U.S. economic news is on the calendar (highlighted on chart) – could cause sharp movement in either direction. Stay alert!
Trade Idea: Look for short entries around current levels with stops above the supply zone. Target the 39,703 and 38,735 levels with proper risk management.
---
Will Dow stay strong or finally give in to bearish pressure? Let me know your thoughts in the comments!
#US30 #DowJones #SupplyAndDemand #TechnicalAnalysis #SmartMoney #VolumeProfile #LuxAlgo #PriceAction #Forex #Indices #MarketUpdate
DowJones INTRADAY awaits Fed Rate Decision Key Support and Resistance Levels
Resistance Level 1: 41,450
Resistance Level 2: 41,900
Resistance Level 3: 42,470
Support Level 1: 40,220
Support Level 2: 39,760
Support Level 3: 39,150
This communication is for informational purposes only and should not be viewed as any form of recommendation as to a particular course of action or as investment advice. It is not intended as an offer or solicitation for the purchase or sale of any financial instrument or as an official confirmation of any transaction. Opinions, estimates and assumptions expressed herein are made as of the date of this communication and are subject to change without notice. This communication has been prepared based upon information, including market prices, data and other information, believed to be reliable; however, Trade Nation does not warrant its completeness or accuracy. All market prices and market data contained in or attached to this communication are indicative and subject to change without notice.

Dow Jones Wave Analysis – 2 May 2025- Dow Jones broke resistance zone
- Likely to rise to resistance level 42000.00
Dow Jones index recently broke the resistance zone between the pivotal resistance level 40815.00 (former support from March and the top of wave A from the start of April) and the 61.8% Fibonacci correction of the downward impulse 5 from March.
The breakout of this resistance zone continues the C-wave of the active ABC correction (2) from the start of April.
Dow Jones index can be expected to rise to the next resistance level 42000.00 (target price for the completion of the active impulse wave C).

DOW JONES BUY SETUP M30 market BOFYesterday market trap for buyer but main important thing was TODAY FOMC AFTER MARKET GONNA MORE FLY💸💯
MORE DETAILS DM

US30 – Chop or Fakeout?🔴 US30 – Chop or Fakeout? 🔴
May 2, 2025 – 1H Chart Update
After the bullish breakout above 40,700 yesterday, US30 surged to 41,051, but we’re now seeing price stalling just under that level, forming a potential double top or distribution pattern ⚠️
📊 Technical Breakdown:
🧱 Price rejected at ~41,050 (previous swing high zone)
📉 Small pullback forming after strong bullish leg
📍 Key short-term support still at 40,700
🧠 Market could be consolidating post-FOMC run or prepping for a deeper pullback
🎯 What to Watch:
Bullish Continuation Setup:
✅ Needs a 1H candle close above 41,050
🎯 Target: 42,000 → 42,359 resistance zone
Bearish Scenario:
🔻 Break below 40,700 flips structure short
🎯 Downside targets: 40,260 → 39,775
Neutral Bias If:
Price consolidates between 40,700 – 41,050 = no clear trend → stay flat

Bearish drop off overlap resistance?Dow Jones (US30) is reacting off the pivot which has been identified as an overlap resistance and could drop to the 1st support.
Pivot: 40,653.80
1st Support: 39,356.30
1st Resistance: 41,490.90
Risk Warning:
Trading Forex and CFDs carries a high level of risk to your capital and you should only trade with money you can afford to lose. Trading Forex and CFDs may not be suitable for all investors, so please ensure that you fully understand the risks involved and seek independent advice if necessary.
Disclaimer:
The above opinions given constitute general market commentary, and do not constitute the opinion or advice of IC Markets or any form of personal or investment advice.
Any opinions, news, research, analyses, prices, other information, or links to third-party sites contained on this website are provided on an "as-is" basis, are intended only to be informative, is not an advice nor a recommendation, nor research, or a record of our trading prices, or an offer of, or solicitation for a transaction in any financial instrument and thus should not be treated as such. The information provided does not involve any specific investment objectives, financial situation and needs of any specific person who may receive it. Please be aware, that past performance is not a reliable indicator of future performance and/or results. Past Performance or Forward-looking scenarios based upon the reasonable beliefs of the third-party provider are not a guarantee of future performance. Actual results may differ materially from those anticipated in forward-looking or past performance statements. IC Markets makes no representation or warranty and assumes no liability as to the accuracy or completeness of the information provided, nor any loss arising from any investment based on a recommendation, forecast or any information supplied by any third-party.

Trade Idea: Long (MARKET)Technical Confluence:
Daily Chart:
• Strong bullish engulfing recovery from recent support (~37,700).
• MACD starting to curl back up from deeply negative levels — possible trend reversal.
• RSI recovering above 50 (currently 52.49), suggesting bullish strength resuming.
15-Min Chart:
• Sustained uptrend with pullbacks respecting the moving average.
• MACD crossing positive territory.
• RSI at 64.77 with room to move higher before hitting overbought levels.
3-Min Chart:
• Tight consolidation after a sharp breakout to 40,766 — forming a potential bull flag.
• RSI at 58.89 — mid-level with upward momentum potential.
• MACD histogram shrinking — possible continuation breakout imminent.
⸻
Fundamental Context:
• Market Sentiment: U.S. markets are generally supported due to strong earnings reports and decreasing recession fears. Treasury yields have stabilized, and risk appetite is returning.
• Upcoming Events: FOMC rate decision is key — bullish bias if they hold or soften tone.
⸻
Trade Details:
• Entry: 40,770
• Price is consolidating just under this resistance. Enter on breakout with volume confirmation.
• Stop Loss (SL): 40,350
• Below recent support on the 15M chart and under the moving average. Conservative SL with volatility in mind.
• Take Profit (TP): 41,450
• Measured move from the flag pattern and aligns with Fibonacci extension and historical resistance.
FUSIONMARKETS:US30

DowJones INTRADAY NFP volatility trigger! Momentum is bullish, but today’s NFP report is a key risk event. A weaker-than-expected jobs number could reinforce rate cut bets and extend the rally. A surprise beat may trigger profit-taking.
Key Support and Resistance Levels
Resistance Level 1: 41200
Resistance Level 2: 42000
Resistance Level 3: 42710
Support Level 1: 39446
Support Level 2: 38490
Support Level 3: 37840
This communication is for informational purposes only and should not be viewed as any form of recommendation as to a particular course of action or as investment advice. It is not intended as an offer or solicitation for the purchase or sale of any financial instrument or as an official confirmation of any transaction. Opinions, estimates and assumptions expressed herein are made as of the date of this communication and are subject to change without notice. This communication has been prepared based upon information, including market prices, data and other information, believed to be reliable; however, Trade Nation does not warrant its completeness or accuracy. All market prices and market data contained in or attached to this communication are indicative and subject to change without notice.

US30 - AnalysisKey Levels to look for:
Resistance - 41250
Support - 40800
Currently price show a neutral trend. Resistance level must be broken for a bullish outlook as long as support is respected. A double top formation near resistance level. Failure to break this level will result in retest of support level.

US30 Buy NFPHere is my NFP signal, buy US30. There is a clear bullish flag. Buy gold, buy gbpusd. We are flushing the usd today

DJI: This looks huge!The Dow Jones has broken above its 125 year trend line and right now it looks like it may have a successful re-test, which could be huge.

long ideaThis Analysis Can Change At Anytime Without Notice And It Is Only For educational Purpose to Traders To Make Independent Investments Decisions.
Disclaimer
The information and publications are not meant to be, and do not constitute, financial, investment, trading, or other types of advice or recommendations supplied or endorsed by TradingView

Rejection at Supply Zone – Bearish Targets Loaded!Price has been rejected at the key supply zone near 41,119, with a sharp drop confirming bearish momentum.
We’re now trading below 40,736, heading toward the first demand zone around 39,884. If that breaks, the next high-volume support area is 38,397, as shown by the visible range and demand zone.
Bearish Bias
Strong rejection from supply
Lower highs forming
Watching for breakdown below 39,884 to add more short positions
Upcoming Events:
Big US data + FOMC sentiment could accelerate the move. Stay sharp!
What’s your bias – Short or Buy the Dip? Drop your thoughts below!
#US30 #DowJones #SupplyAndDemand #PriceAction #TradingView #SmartMoney #BearishSetup

Weekly Forex Outlook Sun.May.4.2025 - Fri.May.9.2025Like and Comments would be appreciated :D Not Financial Advice, Just my outlook/opinion
