DowJones INTRADAY resistance retestKey Support and Resistance Levels
Resistance Level 1: 41,900
Resistance Level 2: 42,470
Resistance Level 3: 43,600
Support Level 1: 40,680
Support Level 2: 40,240
Support Level 3: 39,700
This communication is for informational purposes only and should not be viewed as any form of recommendation as to a particular course of action or as investment advice. It is not intended as an offer or solicitation for the purchase or sale of any financial instrument or as an official confirmation of any transaction. Opinions, estimates and assumptions expressed herein are made as of the date of this communication and are subject to change without notice. This communication has been prepared based upon information, including market prices, data and other information, believed to be reliable; however, Trade Nation does not warrant its completeness or accuracy. All market prices and market data contained in or attached to this communication are indicative and subject to change without notice.
WALLSTREETCFD trade ideas

Dow Jons artistic outlook - a proposition for you to take or disWhen I'm looking at my chart, i like to know what this story is about.
This is what
the whole world is looking at,
some say between 1-5 years from, now we are all going to see what it is about.
Most of us want to prosper but there is a certain minority group who doesn't want that. Why? IDK tell me that.
--------------------------------------------------
The chart do not represent a prediction of any kind its more an invitation how to start thinking -about build.
---------------------------------------------------
Time is short although my chart is on 12 month time line
=================================================
they say 1-5 years but very unlikely now. I don't know if you can see that
there is a time in next 3 years when the trend goes up.
Its my 10 years of experience i and some hard challenging times. i tracked dow nearly 24/7 for 3 years now so i know what it is about. to explain it to you in full could take some time and here is not a place to do just that.
You can see some general shapes and possible traversals, it happens i track them quite correctly due to my different mind.
"I have good intuition when I'm true to myself
this is my point of view I hope to share with you."
SimonTheBeekeeper
PS:
when things starts to move fast
i have my map to find out
where and how.
--------------
thanks for watching I

US30 Stuck at Resistance – 05/05/2025🛑 US30 Stuck at Resistance – 05/05/2025 🛑
📈 Strong Bounce – But Watch This Supply Zone!
US30 ripped from the 36,700s all the way back above 41,000 🔥 — but now we’re seeing price stall just under a major resistance zone at 41,200–41,300. Bulls have full control for now, but signs of exhaustion are building 🥵.
🔍 Key Observations:
🔹 Price holding above 40,700 (key support)
🔹 41,200–41,300 = local resistance zone
🔹 42,359 = next major upside target 🎯
🔹 EMAs still bullish but starting to curve → 🌀 possible slowdown?
⚠️ Expect a squeeze or rejection play soon — market is winding up for the next breakout or pullback 💣.
🎯 Trade Plan:
🟰 Current range = 40,700 – 41,300
🔻 Lose 40,700 = retrace likely to 39,775, possibly 39,200
🚀 Break + close above 41,300 = upside open toward 42,359–42,787
🧠 Mindset Reminder:
🔁 Don’t chase highs! Wait for clean structure or rejection
⚡ When EMAs compress, expect volatility to explode
💎 Patience + plan = edge

possibity of uptrendIt is expected that a corrective and fluctuating trend will form in the current resistance range. Then the upward trend will likely continue.

DowJones INTRADAY at pivotal zone Key Support and Resistance Levels
Resistance Level 1: 41200
Resistance Level 2: 42000
Resistance Level 3: 42710
Support Level 1: 39446
Support Level 2: 38490
Support Level 3: 37840
This communication is for informational purposes only and should not be viewed as any form of recommendation as to a particular course of action or as investment advice. It is not intended as an offer or solicitation for the purchase or sale of any financial instrument or as an official confirmation of any transaction. Opinions, estimates and assumptions expressed herein are made as of the date of this communication and are subject to change without notice. This communication has been prepared based upon information, including market prices, data and other information, believed to be reliable; however, Trade Nation does not warrant its completeness or accuracy. All market prices and market data contained in or attached to this communication are indicative and subject to change without notice.

Everyone I am shorting DOW/US30Team I am shorting DOW, - MUST have stop loss the price could hit 40912-16 - but short slowly now, with STOP loss at 40960-65
Target 1 at 40750-40735 - reduce 30% volume
Target 2 at 40650-40600 - reduce 50% volume
Target 3 at 40550-740483 - remaining
Once the price reaches the first target, bring STOP LOSS TO BE
NEXT week, I will be releasing a video on how I made 1000% profit in 4 weeks. I would love to share my strategy with the world.

US30 Breakout Confirmed – May 1, 2025 🔥 US30 Breakout Confirmed – May 1, 2025 🔥
📈 We Finally Cleared the Range!
US30 just exploded past the 40,360-40,700 resistance, tagging 40,870 with strength. This is the clean breakout bulls were waiting for — structure broke, EMAs supporting, and momentum’s on the side of the buyers 💪📊
🔍 Technical Breakdown:
✅ Clean breakout above 40,700
📈 Higher highs + higher lows confirmed since 4/19
🧠 Break + retest of 39,775 support zone last week
📊 EMAs (blue & white) strongly sloped upward = trend confirmation
🎯 Trade Ideas:
Breakout Pullback Entry:
🔁 Wait for a retest of 40,700 – 40,750
🎯 Targets: 41,200 → 42,000 → 42,359
Aggressive Longs:
Enter now with tight risk under 40,700
📍 Target next resistance at 42,359 or even 42,787 in the coming sessions
Bearish Invalidated Until:
🔻 39,775 breaks — no shorts while above EMAs + structure

Dow Jones Potential UpsidesHey Traders, in today's trading session we are monitoring US30 for a buying opportunity around 40400 zone, Dow Jones is trading in an uptrend and currently is in a correction phase in which it is approaching the trend at 40400 support and resistance area.
Trade safe, Joe.
Hanzo | US30 15 min Breaks – Confirm the Next Bullish Move🆚 US30 – Hanzo’s Strike Setup
🔥 Timeframe: 15-Minute (15M)
——————
💯 Main Focus: Bullish Breakout at 40500
We are watching this zone closely.
———
Analysis
👌 Market Signs (15M TF):
• Liquidity Grab + CHoCH at 40420
• Liquidity Grab + CHoCH at 39870
• Strong Rejections seen at:
➗ 39900 – Major support / Key level
➗ 40300 : 40400 – Proven resistance
🩸 Key Zones to Watch:
• 40200 – 🔥 Bullish breakout level X 3 Swing Retest
• 40550 – Strong resistance (tested 5 times)
• 40200 – Equal lows
• 40420 – Equal highs

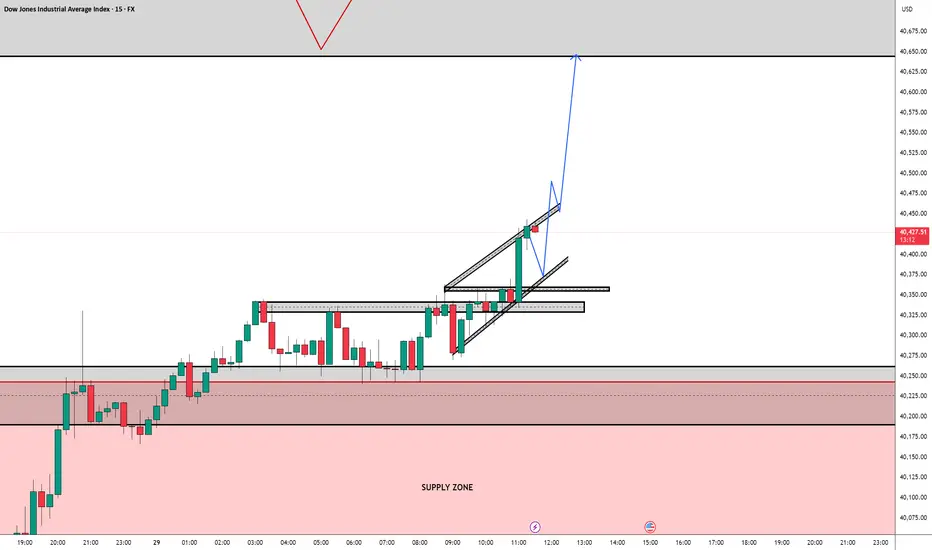
Trade Idea: Long Bias on US30I'm currently monitoring a potential long setup on US30. Price has broken out of a consolidation zone and is respecting an ascending channel. A breakout and retest pattern is forming around the upper trendline, with strong bullish momentum following a clean break of resistance near 40,350. I'm anticipating a brief pullback toward the breakout area (marked by the demand zone and retest block), followed by a continuation to the upside toward the 40,620–40,650 supply zone.
Trade Direction: Long
Entry Zone: 40,350–40,375 (on retest confirmation)
Target: 40,620–40,650
Invalidation: Clean break below 40,300
Context: Strong impulsive breakout + channel breakout with clear liquidity sweep below prior lows.
📌 Disclaimer: This is my personal analysis and should not be taken as financial advice. I’m still learning and refining my strategy — please do your own research and manage your risk carefully.
KEEP BUY ON US30!!!!!!Yesterday us30 completed +3,700pips from my entry point right now we have a liquidity sweep from the sell side am still going long from this point with my initial target at 40,701
JOIN AND ENJOY.........

US30 TO TANK DOWN!!!??Good day traders, unlike on US100 and S&P500 US30 is showing failure to break higher highs and is forming lower lows using or Golden zones, currently inside the range that i outlined we have a bearish market structure shift, i am expecting the market to tap into our FVG @40075.5 then tank down tho our sellside liquidity @39721.3
ENTRY:40075.5
SL: 40190.0
TP:39721.3

A deeper pullback will occur soon!Hello, traders
Based on the chart of the Dow Jones Industrial Average, there appears to be a significant probability of a deeper correction from the current resistance levels. The index has formed what looks like a double top pattern near the 40,400 level, with notable resistance zones highlighted in blue on the chart. After recovering from the early April selloff that took the index down to around 36,600, the Dow has been unable to reclaim previous highs, instead facing rejection at these resistance levels. This price behavior, combined with the technical setup shown on the chart, indicates that we could see a more substantial pullback in the coming sessions if these resistance levels continue to hold.

US30 - 30 mins candle demand zone potential Potential Demand zone entry IF price hits that level.... Thoughts?

"US30/DJI" Index Market Bullish Robbery (Swing Trade Plan)🌟Hi! Hola! Ola! Bonjour! Hallo! Marhaba!🌟
Dear Money Makers & Robbers, 🤑 💰💸✈️
Based on 🔥Thief Trading style technical and fundamental analysis🔥, here is our master plan to heist the "US30/DJI" Index Market Heist. Please adhere to the strategy I've outlined in the chart, which emphasizes long entry. Our aim is to escape near the high-risk YELLOW MA Zone. It's a Risky level, overbought market, consolidation, trend reversal, trap at the level where traders and bearish robbers are stronger. 🏆💸"Take profit and treat yourself, traders. You deserve it!💪🏆🎉
Entry 📈 : "The vault is wide open! Swipe the Bullish loot at any price - the heist is on!
however I advise to Place buy limit orders within a 15 or 30 minute timeframe most recent or swing, low or high level. I Highly recommended you to put alert in your chart.
Stop Loss 🛑:
Thief SL placed at the Nearest / Swing low level Using the 3H timeframe (39200) Day/Swing trade basis.
SL is based on your risk of the trade, lot size and how many multiple orders you have to take.
🏴☠️Target 🎯: 42400
💰💵💸"US30/DJI" Index Money Heist Plan is currently experiencing a bullishness,., driven by several key factors. .☝☝☝
📰🗞️Get & Read the Fundamental, Macro Economics, COT Report, Geopolitical and News Analysis, Sentimental Outlook, Intermarket Analysis, Index-Specific Analysis, Future trend targets with Overall outlook score... go ahead to check 👉👉👉🔗🔗🌎🌏🗺
⚠️Trading Alert : News Releases and Position Management 📰🗞️🚫🚏
As a reminder, news releases can have a significant impact on market prices and volatility. To minimize potential losses and protect your running positions,
we recommend the following:
Avoid taking new trades during news releases
Use trailing stop-loss orders to protect your running positions and lock in profits
💖Supporting our robbery plan 💥Hit the Boost Button💥 will enable us to effortlessly make and steal money 💰💵. Boost the strength of our robbery team. Every day in this market make money with ease by using the Thief Trading Style.🏆💪🤝❤️🎉🚀
I'll see you soon with another heist plan, so stay tuned 🤑🐱👤🤗🤩

US30: Long Position Setup – Buyers Target Key ResistanceOverview:
The US30 index (Dow Jones Industrial Average) presents a clear long setup as price tests a crucial support zone, with potential bullish momentum targeting higher resistance levels. The chart's long position tool highlights a well-defined risk-to-reward framework.
Key Details from the Chart:
Long Position Tool Breakdown:
Entry Point: Price hovering near the support level, suggesting a strong buying opportunity.
Stop-Loss Level: Positioned slightly below the support to limit downside risk.
Take-Profit Target: Aiming for the next resistance zone above current price levels.
Support and Resistance Analysis:
Support Zone: A reliable level where buyers have repeatedly entered the market.
Resistance Zone: Above the take-profit target, where sellers might step in and stall upward movement.
Volume Insights:
Increased buying interest near the support level signals bullish sentiment. Volume profile analysis confirms strong participation at these levels.
Long Trade Plan:
Entry Strategy: Initiate long positions near the support level, ensuring confirmation with bullish candlestick patterns or a surge in buying volume.
Stop-Loss Placement: Secure the position with a stop-loss below the support level to protect against adverse price movements.
Take-Profit Levels: Target the resistance zone, maximizing potential gains while maintaining favorable risk management.
Market Sentiment:
The chart reflects growing buyer interest, with price action likely to push higher as long as the support zone holds. Traders should remain vigilant for reversal signals and manage positions accordingly.
Closing Thoughts: This long trade setup on US30 offers a well-balanced approach, allowing traders to capitalize on bullish momentum while minimizing risk. As always, patience and discipline are key to executing trades effectively.

US30 Trading Into Major Resistance - Look For Dow Jones Retrace🔍 US30 Analysis: At the moment, I'm watching the US30 as it looks overextended 📈 and is trading into previous highs. 🧱 If you look left on the chart, it's approaching a key resistance level on both the weekly and daily timeframes.
I’m expecting a potential retracement 🔁 and monitoring for a bearish break of structure on the 30-minute timeframe ⏱️ as a possible setup for a counter-trend short 📉 — aiming for the imbalance zone visible on that timeframe.
📏 Drawing a Fibonacci retracement from the recent swing low to high, the 50% equilibrium 🔄 lines up perfectly with the imbalance area, adding confluence to the idea.
📚 This is shared for educational purposes only and should not be considered financial advice 💼.

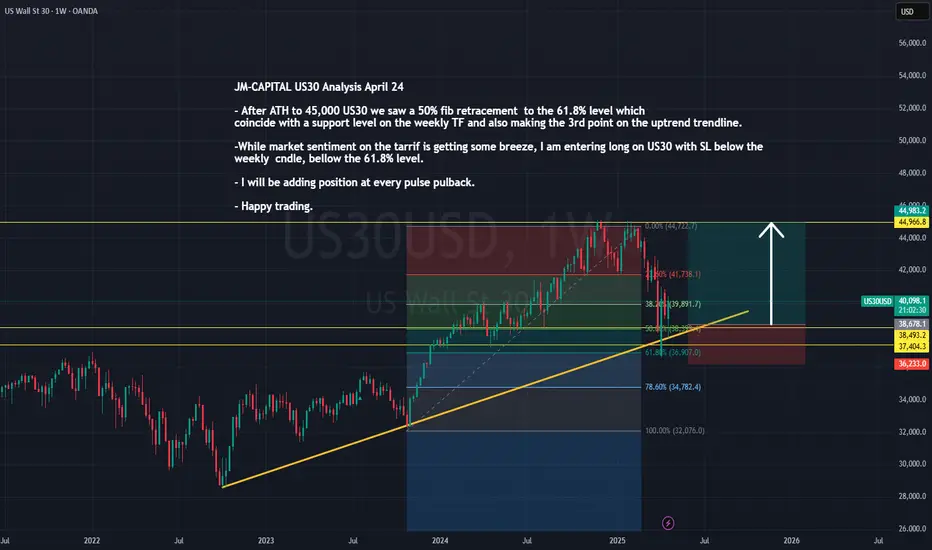
JM-CAPITAL US30 Analysis April 24After reaching an all-time high of 45,000, US30 experienced a pullback, retracing to the 61.8% Fibonacci level—aligning perfectly with a key support zone on the weekly timeframe and forming the third touchpoint on the ascending trendline.
With market sentiment beginning to ease around the tariff discussions, I’m taking a long position on US30. My stop loss is set just below the weekly candle and beneath the 61.8% Fibonacci level for added protection.
I plan to scale into the trade by adding positions on each corrective pullback in line with the bullish structure.
Wishing you all a profitable trading session. Stay sharp!
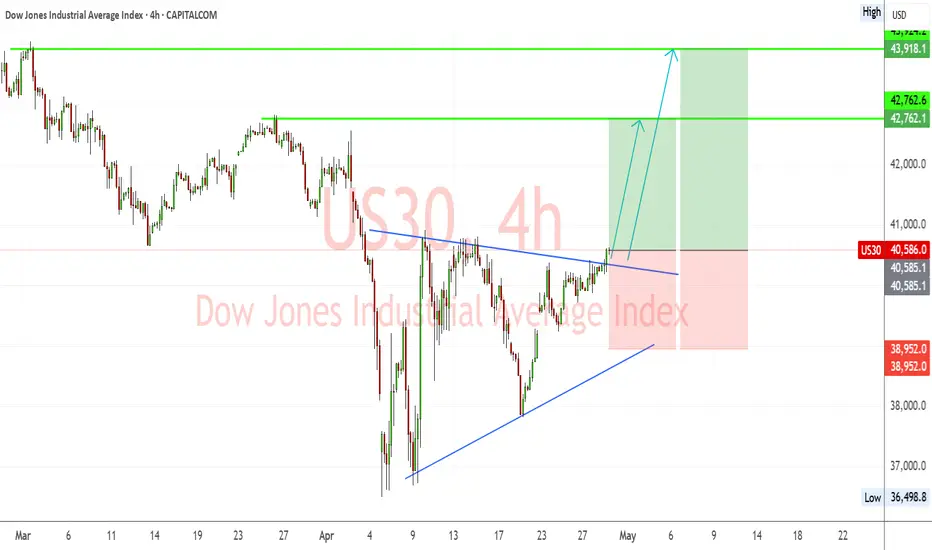
US30 Breakout from Symmetrical Triangle – Bullish Targets EyedUS30 (Dow Jones) has successfully broken out of a symmetrical triangle consolidation pattern, signaling a shift toward bullish momentum. The breakout is occurring after a strong recovery from April lows, with higher lows supporting upward price pressure.
🔹 Chart Structure:
Symmetrical triangle with a clean breakout above descending resistance.
Series of higher lows indicating accumulation.
Bullish breakout confirmed with price pushing above the 40,580 zone.
🔑 Key Levels:
Current Price: 40,586
Breakout Confirmation Level: 40,580
Immediate Resistance/TP1: 42,762
Major Resistance/TP2: 43,924
Support Zone: 38,950
Invalidation/Stop Level: Below 38,950
✅ Bullish Confluence Factors:
Breakout of symmetrical triangle pattern
Higher lows indicate bullish strength and accumulation
Momentum shift visible on lower timeframes
Positive correlation with improving US equity market sentiment
Anticipation of dovish Fed tone could boost equities
🧠 Fundamental Context:
Market is cautiously optimistic ahead of FOMC this week; dovish stance expected due to recent soft economic indicators.
Earnings season tailwinds and lower bond yields support index gains.
Ongoing political and tariff-related headlines may cause volatility, but technical breakout remains in focus.
💡 Trade Idea:
Bias: Bullish
Entry: On successful retest of 40,580 or continuation above 40,600
TP1: 42,762
TP2: 43,924
Stop Loss: Below 38,950
📌 Note: Watch for pullbacks to triangle resistance-turned-support. FOMC and US macro data releases midweek can impact momentum.
Potential declineDow Jones is currently struggling to reach 40,872. The index has been rising slowly daily, but the bullish move might decline if it cannot surpass the 40,872 barrier. The bearish move will be fulfilled if price action manages to remain under 40,800, stabilise below the 40,232 and 40,000. This is because of breaking out of the bullish trend and remaining outside and under the mentioned barriers, which will spearhead the likelihood of a downward trajectory.
The potential fall may target 39200 and 38900, which may also lead to the development of the right shoulder of the inverse head and shoulder pattern, potentially for a bullish rise. However, if price action fails to go down and also stabilises above the 40872, the index will likely continue rising into the 41,000 and 42,000s.

US30 LOCAL SHORT|
✅DOW JONES is going up now
But a strong resistance level is ahead at 40,947
Thus I am expecting a pullback
And a move down towards the target of 40,314
SHORT🔥
✅Like and subscribe to never miss a new idea!✅
Disclosure: I am part of Trade Nation's Influencer program and receive a monthly fee for using their TradingView charts in my analysis.

US30: Time to Reverse or Push Higher?Hey Traders,
As you can see on the chart, price tapped into a major level around the $37,000 area, where we saw a weekly liquidity grab followed by a 4H change of character — leading to a strong push up to the $40,800 zone.
Now, we’re looking at two possible scenarios:
📌 Scenario 1:
Price pulls back to the $39,100 area and gives a solid 4H confirmation → Targeting the $41,000 zone.
📌 Scenario 2:
Price breaks below the $39,100 area and the trendline, then pulls back into the same level with confirmation → Targeting the $37,000 / $36,000 area.
⚠️ This is not financial advice — just sharing my view on the current setup.
Be safe, be happy, and have a great trading day.
– Mr. Wolf 🐺

Potential Formation of a Triangle Pattern ObservedOn the daily timeframe, the Dow Jones movement currently presents two possible scenarios.
Under the black label, there is a potential formation of a triangle pattern, suggesting that the Dow Jones may enter a prolonged consolidation phase to complete wave B, with an expected range between 38,200 and 40,400.
However, under the red label (alternative scenario), a bearish triangle could be forming as part of wave X.
