WIF/USDT — Ready to Wake Up?🚀 WIF (Dogwifhat) might be gearing up for a major breakout.
After months of decline, the weekly chart is showing a potential reversal setup directly from the most significant accumulation zone.
🔍 Technical Overview
• Descending Channel (since early 2024):
Price has been respecting a long-term

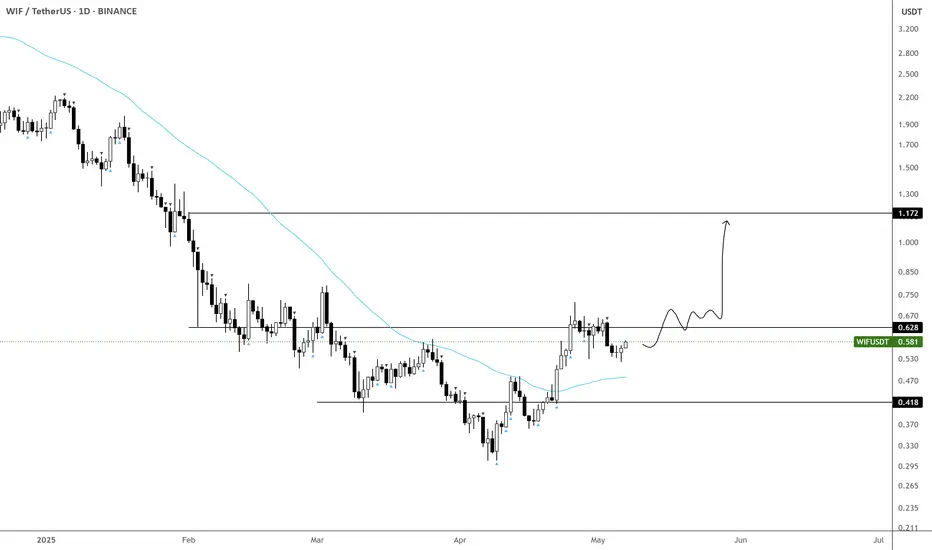
Time to Accumulate $WIF - $1.2 is NextWIF finally showing signs of life.
Starting to build a position below 60c—this looks like an optimal entry given how well it's behaving.
Accumulation zone remains between 40–50c, as long as price holds there.
Targeting the 1.2 area on a break and hold above 65c.
BINANCE:WIFUSDT SEED_WAN
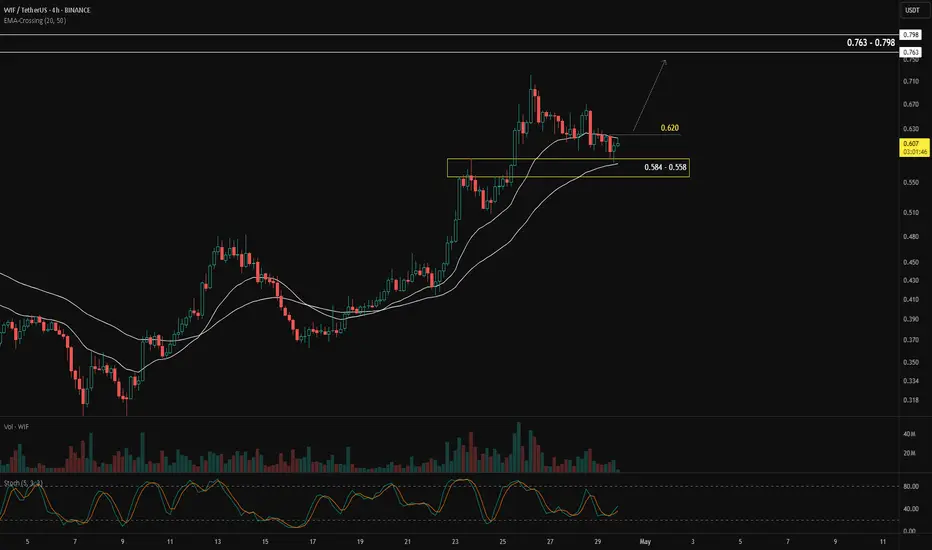
WIF longWIF is bouncing off the bullish trendline and the support level. The bullish movement to the resistance level at $0.69 is expected to happen

Wif Short Daily bullish but is correcting
4hr and 1hr already flipped bearish.
Market not at strong support where enough demand is likely to come back in to make new Daily HL
-DTT
See targets and stop on chart

WIFUSDT.P 1H Chart Pattern WIFUSDT.P 1H Time Frame Make A Chart Pattren. We are Waiting For The Bullish Tag To Form on Our CGI Indicator

When Moving Averages Meet the Demand ZoneOne of the simplest ways to identify the market trend is by using the moving average (MA) indicator.
When price moves above the MA, it's generally considered an uptrend.
When price moves below the MA, it's seen as a downtrend.
Aside from showing the trend, moving averages can also act as dyna
BEARISH ON WIFUSDTThe bearish confluences are back by the following confluences:
1) Market Structure(BoS), 2) Liquidity, 3) QM-Orderblock(POI).
To target a minimum of 1:2.5RR.
Note: the market is all about probabilities which also makes my analysis a probability.

WIF Weekly Outlook – Explosive Setup Unfolding!
#WIF has broken out of a falling wedge formation on the weekly timeframe, indicating the start of a major trend reversal. With strong price action and volume picking up, we're eyeing the following bullish targets:
🎯 T1: $1.124
🎯 T2: $2.676
🎯 T3: $4.135

wif short to $0.57Just now opened a short position on wif. Expecting market to correct down to that area before pushing up to higher prices possibly
Daily correction
See chart

WIFUSDTWIFUSDT
Crypto again show strength that's why I'm bullish in WIFUSDT. It hold good strength to show us upward move. In Crypto, never trade in hurry and always add Qty in layers.
Think about it then make your trade according to your RISK.

See all ideas
Summarizing what the indicators are suggesting.
Oscillators
Neutral
SellBuy
Strong sellStrong buy
Strong sellSellNeutralBuyStrong buy
Oscillators
Neutral
SellBuy
Strong sellStrong buy
Strong sellSellNeutralBuyStrong buy
Summary
Neutral
SellBuy
Strong sellStrong buy
Strong sellSellNeutralBuyStrong buy
Summary
Neutral
SellBuy
Strong sellStrong buy
Strong sellSellNeutralBuyStrong buy
Summary
Neutral
SellBuy
Strong sellStrong buy
Strong sellSellNeutralBuyStrong buy
Moving Averages
Neutral
SellBuy
Strong sellStrong buy
Strong sellSellNeutralBuyStrong buy
Moving Averages
Neutral
SellBuy
Strong sellStrong buy
Strong sellSellNeutralBuyStrong buy
Displays a symbol's price movements over previous years to identify recurring trends.