This chart represents a possible Elliott Wave analysis with fiveKey Points:
Current Situation: According to the chart, the price is in Wave 4, which is a corrective phase. If it holds the support zone (white box), Wave 5 may start.
Support Level: The price is currently testing a key support level. Holding this level could push the price upward.
Target: The next strong resistance is expected between 0.8451 – 0.8877, aligning with Fibonacci retracement levels.
Risk: If the price breaks below the support level, it could drop further, invalidating Wave 5.
Conclusion:
If support holds, a bullish Wave 5 move is expected, aiming for higher resistance levels. However, if support breaks, a further decline is possible.
WIFUSDT.P trade ideas

Long Trade Setup Breakdown for WIF/USDT - 30-Min Chart!📊
🔹 Asset: WIF/USDT
🔹 Timeframe: 30-Min Chart
🔹 Setup Type: Bullish Breakout from Descending Triangle
🚀 Trade Plan (Long Position):
✅ Entry Zone: ~0.670 USDT (Breakout Confirmation)
✅ Stop-Loss (SL): ~0.618 USDT (Below Key Support)
🎯 Take Profit Targets:
📌 TP1: ~0.729 USDT (First Resistance Level)
📌 TP2: ~0.798 USDT (Extended Bullish Target)
📊 Risk-Reward Ratio Calculation:
📈 Risk (Stop-Loss Distance):
0.670 - 0.618 = 0.052 USDT
📈 Reward to TP1:
0.729 - 0.670 = 0.059 USDT
💰 Risk-Reward Ratio to TP1: 1:1.13
📈 Reward to TP2:
0.798 - 0.670 = 0.128 USDT
💰 Risk-Reward Ratio to TP2: 1:2.46
🔍 Technical Analysis & Strategy:
📌 Breakout Confirmation: A strong push above 0.670 USDT signals bullish momentum.
📌 Pattern Formation: Bullish Descending Triangle Breakout, indicating potential upside continuation.
📊 Key Support & Resistance Levels:
🟢 0.618 USDT - Strong Support / Stop-Loss Level
🟡 0.670 USDT - Breakout Zone / Entry Level
🔴 0.729 USDT - First Profit Target / Resistance
🟢 0.798 USDT - Final Target for Momentum Extension
🚀 Momentum Shift Expected:
If price stays above 0.670 USDT, it could rally towards 0.729 USDT and 0.798 USDT.
A high-volume breakout would strengthen the trend continuation.
🔥 Trade Execution & Risk Management:
📊 Volume Confirmation: Ensure strong buying volume above 0.670 USDT before entering.
📈 Trailing Stop Strategy: Move SL to entry (0.670 USDT) after TP1 (0.729 USDT) is hit.
💰 Partial Profit Booking Strategy:
✔ Take 50% profits at 0.729 USDT, let the rest run to 0.798 USDT.
✔ Adjust Stop-Loss to Break-even (0.670 USDT) after TP1 is reached.
⚠️ Fake Breakout Risk:
If price falls below 0.670 USDT, wait for a retest before considering re-entry.
🚀 Final Thoughts:
✔ Bullish Setup – Holding above 0.670 USDT could lead to higher targets.
✔ Momentum Shift Possible – Watch for volume confirmation.
✔ Favorable Risk-Reward Ratio – 1:1.13 to TP1, 1:2.46 to TP2.
💡 Stick to the plan, manage risk, and trade smart! 🚀🏆
🔗 #CryptoTrading #WIFUSDT #BreakoutTrade #TechnicalAnalysis #MarketTrends #ProfittoPath
@vibes12

WIF ANALYSIS (2H)After pumping, changing CH, and clearing a supply zone, the price is now pulling back to lower order blocks.
In the lower zone, there is an overlap between the flip line and the QM level, which appears to be a strong area.
Additionally, the upper order blocks have been consumed, and if the price intends to continue its upward movement, there are no significant sell orders ahead.
Targets are marked on the chart.
A daily candle closing below the invalidation level will invalidate this analysis.
For risk management, please don't forget stop loss and capital management
Comment if you have any questions
Thank You

WIFUSDT 1H – Bullish Breakout from Falling ChannelThe chart shows WIFUSDT breaking out of a falling channel and retesting a key resistance-turned-support zone.
Setup:
The price broke out of the descending channel.
Retesting the breakout zone (yellow box) around 0.7000 - 0.7200.
Potential bullish continuation if support holds.
Entry:
📌 Long entry: 0.6800 - 0.7000 (on retest of support).
Stop-Loss:
⚠️ 0.6500 (below the breakout structure to avoid fakeouts).
Take-Profit Targets:
✅ TP1: 0.7500 (previous structure resistance).
✅ TP2: 0.8200 (next major resistance).
Risk Management:
Risk-Reward Ratio: ~1:3
Invalidation: If price closes below 0.6500, bears regain control.
🚀 Plan: If the support zone holds, expect bullish momentum toward the targets. If it fails, re-evaluate for bearish continuation.
Trading is risky! No setup is 100% correct. Manage your risk properly.

WIF (dogwifhat), my notes for long-termI expect it to rise above 1.48 in the first place, I see it as a buying opportunity between 0.6 - 0.8.
If it manages to rise above $1.48, we may need to re-evaluate the chart. Above, 2.7 - 3.5 - 7.5 can be considered as profit-taking targets. However, the confidence in memecoins has decreased and whether we will see these levels again is unlikely. But as I said, it would be good to do research on the market in general after 1.48. I have allocated a very small portion of my portfolio to this coin.
not investment advice

BUY SPOT SCALPING WIFUSDT🚀 BUY SPOT SCALPING WIFUSDT
📢 Short-term scalping opportunity for WIFUSDT – Quick execution required!
📌 Trade Setup & Market Outlook
✔ Scalping spot trade setup with a tight execution window.
✔ Strict risk management required, as the signal expires after 1-2 days if the target is not met.
📌 Trade Plan:
Trade Type: Scalping Spot (Short-Term).
Entry Point: $0.668.
Target: $0.95 (~42% gain).
Hold Time: 1-2 days, after which the signal is automatically invalidated.
Capital Allocation: 30% of planned capital for this trade.
💡 Key Considerations:
✔ Monitor price action closely for rapid execution.
✔ Exit manually if momentum weakens before hitting the target.
✔ Apply stop-loss protection to manage risk.
🔥 WIFUSDT is set for a quick scalping opportunity – Time-sensitive execution required! 🚀

WIFUSDT Perpetual Contract | Bybit | 1H TFWatching for a breakout! If 0.6237 breaks, targeting 0.6974 as the last TP. If it fails, I’ll close the position.

WIFUSDT 2DWIF ~ 2D Analysis
#WIF If this support block is tested, This will be a very good place of buy. with a minimum target of 20%+.

WIFA suitable place has been designated for buying and also for selling. The range of $0.2963 is suitable for buying. The range of $1.59 is suitable for selling. The analysis has been done solely based on the chart. Thank you for sharing your comments below this post.

WIF - Waking up from the dead?Hey traders! 🚀 Looks like WIF is testing a major support near 0.627 USDT, a critical Gann level.
🔹 Holding above could trigger a reversal towards 0.869 - 1.191 USDT 📈
🔹 A breakdown might lead to further weakness – watch for confirmations!
-Seems like the chance to buy the hat at such cheap prices ^^
-Imho ^^, the worse is likely in and even if we get a pullback, we'll chop around near the lows.
Price at a Strong Support Zone:
The price is testing the 0.627 USDT level, which appears to be a key support in the Gann structure.
This level could act as a potential reversal zone if buyers step in.
2️⃣ Bullish Scenario (Bounce from Support)
If the price respects this support and starts forming bullish candles, we could see an upward move toward:
0.869 USDT (First resistance level)
1.191 USDT (A stronger resistance level and possible target)
3️⃣ Bearish Scenario (Breaking Support)
If 0.627 USDT is broken to the downside, the price might continue dropping toward lower levels such as:
0.400 USDT or lower, based on the Gann structure's projections.
4️⃣ How to Confirm the Direction?
Watch price action at this support level—if bullish reversal candles appear (like a hammer or bullish engulfing), it could signal a potential buy entry.
If the price closes below the support with strong bearish momentum, it could confirm further downside movement.
Watch for price action around the Gann grid lines works as your regular trend lines
it gets better when u recheck the chart after a few weeks too!
💡 Conclusion: The price is at a critical level, so we need to monitor how it reacts here before deciding on the next move! 👀📉📈
🎯 What do you think? Are we going to see a bounce or more downside? 🤔💬

WIF - Nearing downtrend breakoutGreat positive divergences taking place right now on WIF - A move above the trendline should see a snap move towards 0.73 and with BTC price holding, we should see a continuation further up.
There is still a large risk of another BTC move towards 90k, at which point WIF price would get further suppressed. But Risk reward is skewed positively in the long run from these levels.

WIF day tf TAThis chart shows the price dynamics of a cryptocurrency, analyzed using technical analysis. Here's what can be interpreted:
Elliott Waves:
The numbered waves (1–5) indicate impulsive waves based on Elliott Wave Theory.
The (A, B, C) waves represent corrective waves.
Key Zones:
The blue horizontal lines mark significant support and resistance levels.
Patterns and Trends:
Cup and Handle: A bullish formation visible in the earlier period.
Bullish Pennant Pattern: A triangular pattern that suggests a potential continuation of the upward trend.
Falling Wedge: A bullish pattern indicating a potential price breakout to the upside.
Trends:
A downtrend line is visible (bearish trend), but there's a potential for a bullish breakout if the trendline is breached.
The forecast suggests the price may move within the marked "channel" in the near future.
Indicators:
The RSI indicator highlights bear and bull signals. Currently, bullish signals are observed in the lower RSI zone.
"Strong short signals" are marked as potential selling points.
Volume:
Volume plays a crucial role in confirming price movements. Increased volume is noticeable at certain points, potentially signaling market activity.
Summary: The chart shows potential bullish patterns and support zones that could lead to a price increase if resistance levels are broken. However, the descending trendline still poses a bearish risk. Indicators currently point to a bullish scenario, but confirmation is needed through a breakout above key resistance levels.

WIF/USDT – Was That a Fake Breakdown? WIF/USDT – Was That a Fake Breakdown?
WIF showed signs of a breakdown, but it might have been a fake move.
I expect the price to rise soon for the short term. No need to wait for dips, buy and hold. WIF is ready to break out of this zone.
DYOR and trade accordingly.

WIF what's Next... Reversal ?????Key Observations:
Price Action:
The price is currently trading around $0.6584.
The chart shows a strong downtrend from a previous high above $4.00, indicating a long-term bearish trend.
The price has reached a major support zone (marked in green), which aligns with previous accumulation levels before the big uptrend.
Support & Resistance Levels:
Major Support: Around $0.60 - $0.65, where price has previously consolidated.
Major Resistance: Likely around $1.00 (psychological level) and $1.50.
RSI (Relative Strength Index):
Current RSI: 23.97, which is in oversold territory (<30).
This suggests that the asset is heavily oversold and could be due for a bounce or relief rally.
However, RSI alone isn't a strong reversal signal; price action confirmation is needed.
Market Sentiment & Potential Scenarios:
Bullish Case: If the price holds the $0.60 - $0.65 support and forms a bullish pattern (e.g., double bottom, higher low), we could see a bounce towards $1.00 - $1.50.
Bearish Case: If the support breaks, the price could move lower, possibly towards $0.50 or lower before finding new support.
Trading Plan & Risk Management:
Potential Long Entry: If price consolidates above $0.65 with increasing volume and bullish structure.
Stop-Loss: Below $0.58 - $0.60 in case the support fails.
Profit Targets:
First target: $1.00 (psychological level).
Second target: $1.50 (previous resistance zone).
Confirmation Needed: Look for a bullish engulfing candle, increasing volume, or RSI divergence before entering a long position.
Conclusion:
The chart shows oversold conditions at strong historical support.
A potential bounce could happen, but confirmation is needed before entering a trade.
Risk management is crucial, as a breakdown below support could lead to further downside.

Dogwifhat - WIF Long idea Lets reclaim 1.59 lvl and 3$ WIf is on a table
If all goes well I see WIF 5$ + this cycle

Dogwifhat Coin (WIF): Possible Double Top Pattern / FallingDogwifhat coin seems desperate, where price is looking like it is about to fall hard.
We noticed on bigger timeframes the formation of a "double top" pattern, which upon breaking the neckline zone would result in a possible 60% downfall so keep attention at that neckline zone for now!
Swallow Team

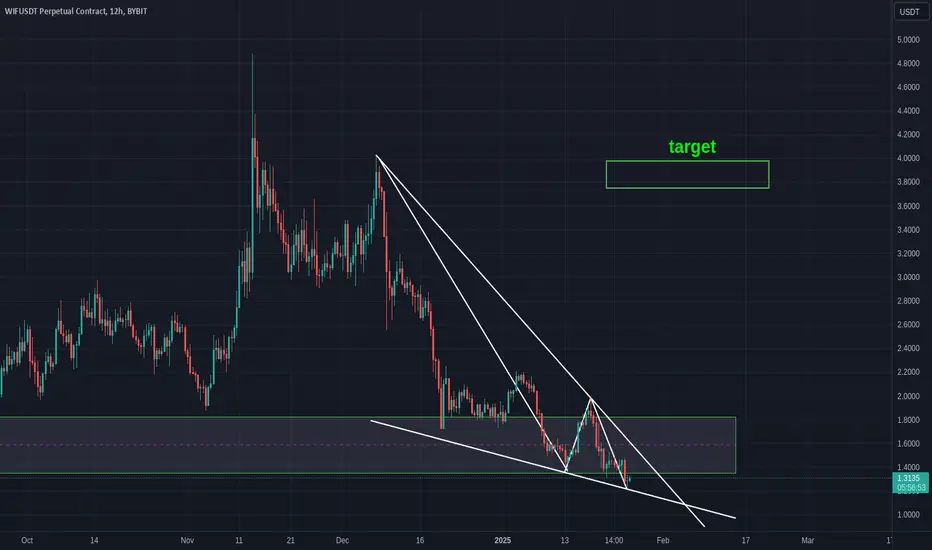
Falling Wedge PatternA falling wedge pattern is currently forming, starting from October 8th. This pattern is characterized by a downward-sloping resistance line (lower highs) and a support line (higher lows) converging over time. The price is tightening within this range, indicating potential bullish pressure building up for an eventual breakout to the upside.
Target Zone: $3.9
Wedge Height:
High near $4.6
Low near $1.5
Approximate height: $3.1
$WIFUSDTbuy on spot, dont take leavrage, protect capital dont get liquidated
oversold zone RSI
Buy at support zone , reversal happen soon , good risk and reward , accumulation zone
Time take to reversal will be super cycle 10X-90X-100X

WIF Bullish Signal !The scenario of bullish is like drinking a coffee and just sit and enjoy!
Entry at the current point seems reasonable...

WIF/USDT Elliott Wave C Analysis1️⃣ Fibonacci Targets for Wave C Completion
Wave C in an ABC correction typically extends to key Fibonacci levels derived from Wave A:
1.000 Fib Extension (~$2.851) → Most common Wave C completion target.
1.236 Fib Extension (~$4.049) → Stronger bearish momentum may push towards this level.
1.382 Fib Extension (~$5.031) → Overextended correction possibility.
1.618 Fib Extension (~$6.144) → Rare but possible deep Wave C completion.
📌 Interpretation: These levels represent potential Wave C termination zones where price might find support before transitioning into a new wave structure.
2️⃣ Fibonacci Retracement Levels for Wave C Support Zones
If the downward correction deepens, these retracement levels act as critical support:
0.618 Fib Retracement (~$0.614) – First deep corrective support, price may attempt a bounce here.
1.236 Fib Retracement (~$0.723) – Key structure validation level, break below signals further downside.
1.382 Fib Retracement (~$0.579) – Final support zone before significant breakdown risk.
📌 Interpretation: A rebound from these levels would support Wave C completion, whereas failure to hold them could indicate prolonged bearish pressure.
3️⃣ Elliott Wave Structure & Wave C Confirmation
Bullish Reversal Conditions
For Wave C to complete and initiate a reversal, the following must happen:
Price must break above the 1.000 Fib Extension ($2.851) to signal bullish intent.
Volume confirmation: A significant increase in buying volume at key support levels.
MACD bullish crossover on mid to high timeframes (1D/4H).
Bearish Risk Factors
Failure to hold $0.614 → Signals continued bearish control.
MACD remains bearish → No confirmation of trend reversal.
No breakout above $2.851 → Suggests deeper downside risk.
📌 Key Reversal Confirmation:
✅ Break above $2.851 → End of Wave C, potential trend shift.
❌ Close below $0.579 → Signals extended correction or potential new bearish trend.
4️⃣ Why Wave 5 is Unlikely
A potential Wave 5 scenario would require:
A break above $4.880 (prior resistance) to confirm a new bullish impulse.
Strong volume and momentum continuation beyond $5.551, $8.43, and $15.347.
📌 Low Probability Factors for Wave 5:
Lack of impulsive wave structure beyond Wave C extension.
Price structure still following corrective ABC movement.
No clear wave formation beyond the corrective phase.
🚨 Conclusion:
Wave 5 is not highly likely unless a breakout above $4.880 occurs, triggering further impulse movement.
5️⃣ Conclusion & Trade Considerations
✅ Primary Scenario (Wave C Completion)
Wave C Targets: $2.851, $4.049, $5.031, $6.144.
Support Zones: $0.614, $0.723, $0.579.
Reversal Confirmation: Break above $2.851 needed to validate end of correction.
❌ Low Probability Scenario (Wave 5)
Invalid unless $4.880 breaks with volume.
Target zones for Wave 5: $5.551, $8.43, $15.347.
Failure to break key levels = no wave 5.
📌 Trade Strategy Considerations:
Look for long entries near Wave C completion zones ($2.851 - $0.614).
Monitor volume & RSI for bullish divergence before confirming trades.
Avoid premature entries until clear reversal signs emerge.

Fake brekout party come.Fake brekout party come. Hi i mena its more liquidation futures contracts. Party time started :) good luck.

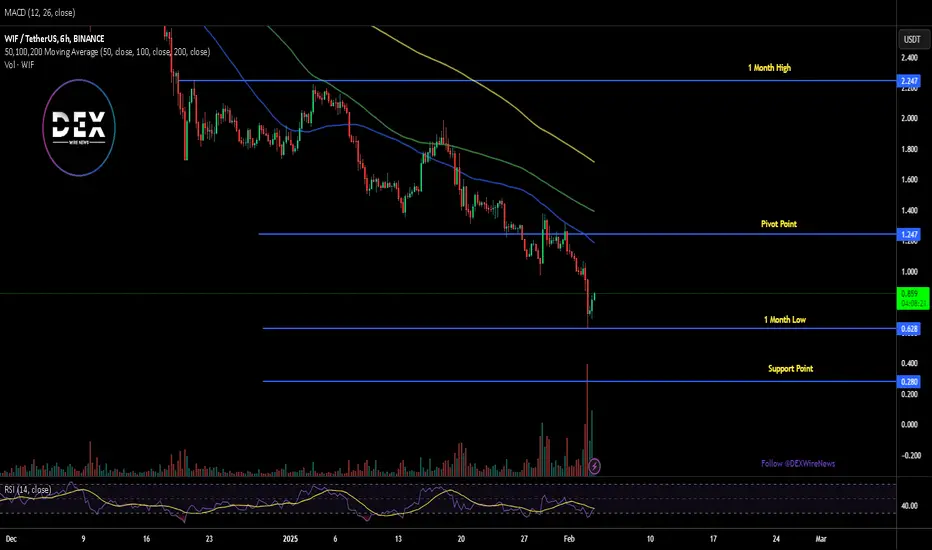
Dogwifhat ($WIF) Breaks $1 Psychological Support – What’s Next?Dogwifhat ( SEED_WANDERIN_JIMZIP900:WIF ), the popular Solana-based meme coin, has experienced a sharp decline, breaking below the critical $1 psychological support and trading at $0.829 at the time of writing. This marks a significant 12.42% drop today, pushing SEED_WANDERIN_JIMZIP900:WIF further from its all-time high (ATH) of $4.83 recorded in March 2024.
The recent dip raises concerns among traders and investors, especially after notable crypto figures, including Arthur Hayes, previously speculated that SEED_WANDERIN_JIMZIP900:WIF could surge to $5. However, current market conditions and technical indicators suggest a different scenario.
Technical Analysis
- Support and Resistance Levels: The one-month low is acting as a short-term support zone. A break below this level could push SEED_WANDERIN_JIMZIP900:WIF further down to $0.29, a critical foreseen support level that might stabilize the asset.
- Fibonacci Retracement Levels: The 38.2% Fibonacci retracement level serves as a key pivot point at $1.24. If SEED_WANDERIN_JIMZIP900:WIF can break above this level, we could see a potential rally towards $2.50 and beyond.
- Relative Strength Index (RSI): With SEED_WANDERIN_JIMZIP900:WIF ’s RSI currently approaching oversold levels, traders may see a short-term bounce, but the overall trend remains bearish unless key resistance levels are broken.
Fundamental Analysis
Dogwifhat ( SEED_WANDERIN_JIMZIP900:WIF ) remains a dominant meme coin on the Solana blockchain, enjoying strong community engagement and significant exchange listings. Here’s a look at its market performance:
- Trading Volume: SEED_WANDERIN_JIMZIP900:WIF ’s 24-hour trading volume surged to $1.62 billion, marking a 134.7% increase, signaling heightened trading activity.
- Exchange Listings: Major exchanges like Binance, MEXC, and LBank continue to facilitate active trading, keeping SEED_WANDERIN_JIMZIP900:WIF accessible to a global audience.
- Historical Performance: Despite its recent decline, SEED_WANDERIN_JIMZIP900:WIF remains significantly above its all-time low of $0.001555 recorded in December 2023, reflecting a massive 54,054.03% increase.
Market Sentiment & Outlook
The ongoing bearish sentiment in the broader crypto market has contributed to SEED_WANDERIN_JIMZIP900:WIF ’s decline. However, meme coins often rely on speculative momentum and social engagement, meaning a resurgence is possible if investor sentiment shifts.
Conclusion
Dogwifhat ( SEED_WANDERIN_JIMZIP900:WIF ) faces a critical test after breaching the $1 support. While the short-term outlook appears bearish, traders are closely watching key support and resistance levels to determine the next move. With strong trading activity and major exchange listings, SEED_WANDERIN_JIMZIP900:WIF is still a player in the meme coin space, but investors should tread carefully amid current volatility.
#WIF Goodbye wif Some naive people think that Trump is a savior and a hero who will bring the crypto market to an altcoin season (Alt Season) with his arrival. Unaware that Trump will do something with crypto that will be recorded in history and the Guinness Book of Records, leading to the complete destruction of this market. It all started with his own meme coin, which caused a severe crash in the entire altcoin and meme coin market. The damage he inflicted on the market with his meme coin had not yet healed when he introduced his wife's meme coin. After that, we witnessed the foolish political-economic statements of his son. Now, he has also started a trade war between countries, and its effects are visible in the crypto market. Do not forget what happened to Trump in America after Trump's presidency ended. Now, he is full of resentment and anger and no longer cares about the people. He is doing everything he can to ensure that he and his inner circle accumulate enough wealth and power so that no one can harm him again.
My advice to you is to avoid trading in the futures market for the next three months, or even six months, and focus only on options and spot trading, with Bitcoin being your primary focus, as government entities are also buying it. However, altcoins and meme coins will soon experience a more severe crash, as Trump has proven that he is not someone who solves problems peacefully and always takes the worst possible actions.
Every crisis in the market is not opportunity to exit altcoins and meme coins. Please adapt yourself to the current conditions; it is no longer like previous years, and do not wait for an altcoin season. There is no altcoin season anymore, because in the past, these seasons were due to the limited number of coins in the market, not now when thousands of new coins are created daily, and governments have also entered the crypto market. Any market that governments enter will never benefit ordinary people unless a miracle happens and conditions change, which I doubt will occur anytime soon.
You never thought prices would reach this level, but they did. Do not think that now is a good time to buy, because prices will go even lower, and this is the beginning of a massive crash that will be recorded in history. Also, keep in mind that since government entities and large companies are buying Bitcoin, they will certainly do something to cause its price to drop so they can buy Bitcoin from ordinary people at lower prices.
Ethereum has also proven that it has not had significant growth during this period. Therefore, try to protect your capital until we get through this crisis created by Trump.
