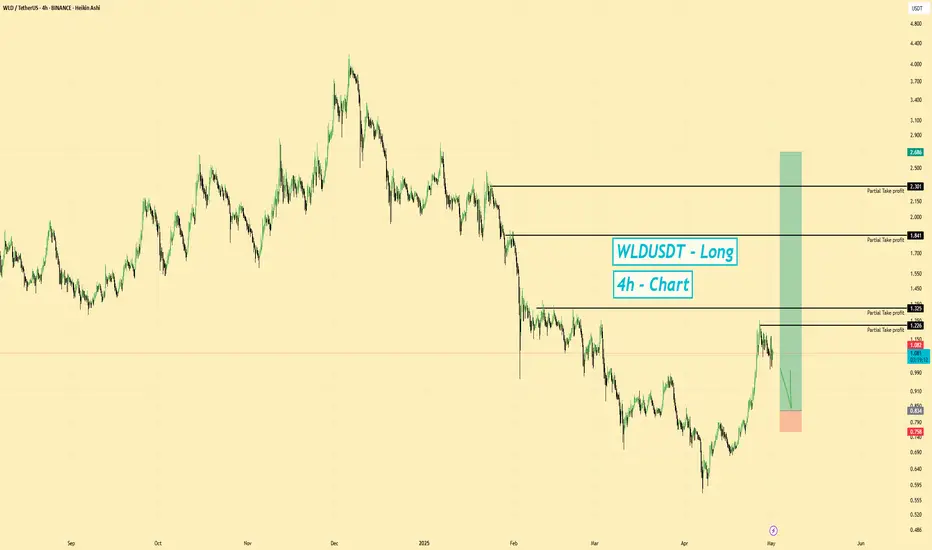
WLDUSD | Long Setup | Potential Correction | (May 2025)WLDUSD | Long Setup | Potential Correction After Downtrend | (May 2025)
1️⃣ Insight Summary
WLD has been showing some strength recently, following Bitcoin's bounce. Although the bigger trend has been bearish since December 2024, we're now seeing signs of a potential short-term correction upward.
2
Worldcoin WLD price analysisSam Altman has officially launched the World ID project in the United States, a digital identity system based on iris scanning.
Users are scanned using the Orb device and receive a digital ID (World ID) and 14 #WLD tokens
Last time then the price of OKX:WLDUSDT has been actively growing , when mor

WLD Bearish Head and Shoulders Pattern ConfirmedWLD Bearish Head and Shoulders Pattern Confirmed 🚨
WLD has formed a bearish head and shoulders pattern and is currently breaking below the red neckline. The target for this bearish move is the green line level.
📈 Technical Overview:
Pattern: Bearish Head and Shoulders
Neckline: Red level, cur

Wldusdt trading ideaWLD initially formed a rising wedge, a well-known bearish reversal pattern, within the External Supply Zone. The break below the wedge triggered a significant drop, pushing price through the Supply Zone before finding support in the Critical Demand Zone, which also aligns with a key Fibonacci retrac

#WLD/USDT#WLD
The price is moving within a descending channel on the 1-hour frame, adhering well to it, and is heading for a strong breakout and retest.
We are seeing a bounce from the lower boundary of the descending channel, which is support at 0.
We have a downtrend on the RSI indicator that is about t

WLDUSDTConsidering the positive news about this currency, which has started operating in six American cities and is attracting attention and focus, and from the technical perspective that you can see, I think it is worth the risk and with proper risk and capital management, we can have it in our portfolio.

WLD/USDTHello friends
Given the price growth we had, the price correction has now managed to make good bottoms, which indicates the strength of the trend, so we can enter the trade.
The purchase and target points have also been identified...
Follow capital management.
*Trade safely with us*

#WLD/USDT#WLD
The price is moving within a descending channel on the 1-hour frame and is expected to continue upward.
We have a trend to stabilize above the 100 moving average once again.
We have a downtrend on the RSI indicator, which supports the upward move by breaking it upward.
We have a support are

#WLD/USDT#WLD
The price is moving within a descending channel on the 1-hour frame, adhering well to it, and is heading for a strong breakout and retest.
We are seeing a bounce from the lower boundary of the descending channel, which is support at 0.725.
We have a downtrend on the RSI indicator that is abou

WLDUSDTmy entry on this trade idea is taken from a point of interest above an inducement (X).. I extended my stoploss area to cover for the whole swing as price can target the liquidity there before going as I anticipate.. just a trade idea, not financial advise
Entry; $1.407
Take Profit; $1.216
Stop Lo

See all ideas
Summarizing what the indicators are suggesting.
Oscillators
Neutral
SellBuy
Strong sellStrong buy
Strong sellSellNeutralBuyStrong buy
Oscillators
Neutral
SellBuy
Strong sellStrong buy
Strong sellSellNeutralBuyStrong buy
Summary
Neutral
SellBuy
Strong sellStrong buy
Strong sellSellNeutralBuyStrong buy
Summary
Neutral
SellBuy
Strong sellStrong buy
Strong sellSellNeutralBuyStrong buy
Summary
Neutral
SellBuy
Strong sellStrong buy
Strong sellSellNeutralBuyStrong buy
Moving Averages
Neutral
SellBuy
Strong sellStrong buy
Strong sellSellNeutralBuyStrong buy
Moving Averages
Neutral
SellBuy
Strong sellStrong buy
Strong sellSellNeutralBuyStrong buy
Displays a symbol's price movements over previous years to identify recurring trends.