#WLD/USDT#WLD
The price is moving within a descending channel on the 1-hour frame, adhering well to it, and is heading for a strong breakout and retest.
We are seeing a bounce from the lower boundary of the descending channel, which is support at 0.
We have a downtrend on the RSI indicator that is about to break and retest, supporting the upside.
We are looking for stability above the 100 moving average.
Entry price: 0.878
First target: 0.946
Second target: 0.984
Third target: 1.03
WLDUSDT.P trade ideas

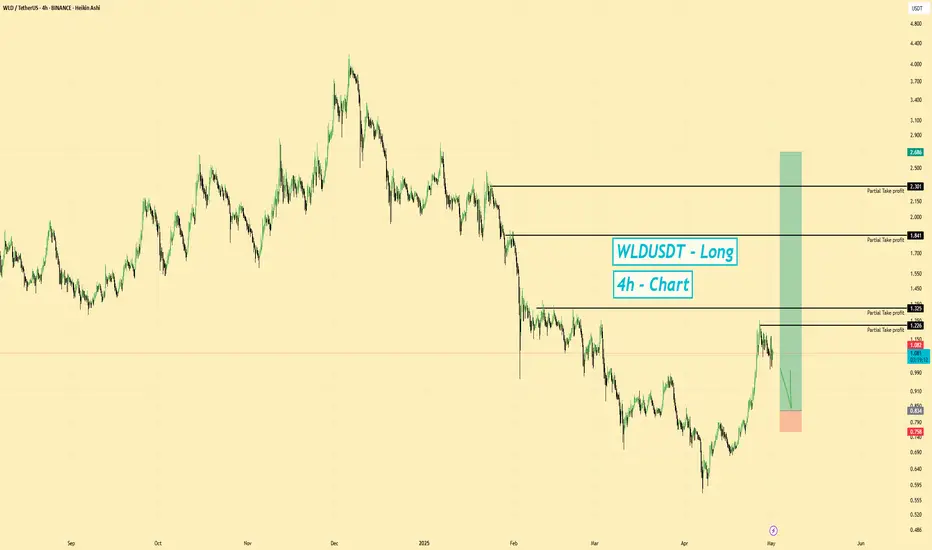
WLDUSD | Long Setup | Potential Correction | (May 2025)WLDUSD | Long Setup | Potential Correction After Downtrend | (May 2025)
1️⃣ Insight Summary
WLD has been showing some strength recently, following Bitcoin's bounce. Although the bigger trend has been bearish since December 2024, we're now seeing signs of a potential short-term correction upward.
2️⃣ Trade Parameters
Bias: Long
Entry Zone: $0.90 – $0.92835 (wait for a reclaim and retest as support)
Stop Loss: $0.765
TP1: $1.22
TP2: $1.32
TP3: $1.84
Final Target (Stretch Goal): $2.50
Partial Exits: TP1 and TP2 will be aggressive exits, while the rest of the position will be managed more passively.
3️⃣ Key Notes
✅ WLD is reacting to Bitcoin's recent strength, which could support this corrective move.
❌ However, the macro trend is still bearish, so it’s essential to wait for confirmation (reclaiming the entry zone as support).
📊 Keep an eye on BTC and broader market sentiment to gauge continuation potential.
4️⃣ Follow-up Note
Will review the setup and update if we break the current entry zone or reject before confirmation.
Please LIKE 👍, FOLLOW ✅, SHARE 🙌 and COMMENT ✍ if you enjoy this idea! Also share your ideas and charts in the comments section below! This is the best way to keep it relevant, support us, keep the content here free and allow the idea to reach as many people as possible.
Disclaimer: This is not financial advice. Always conduct your own research. This content may include enhancements made using AI.
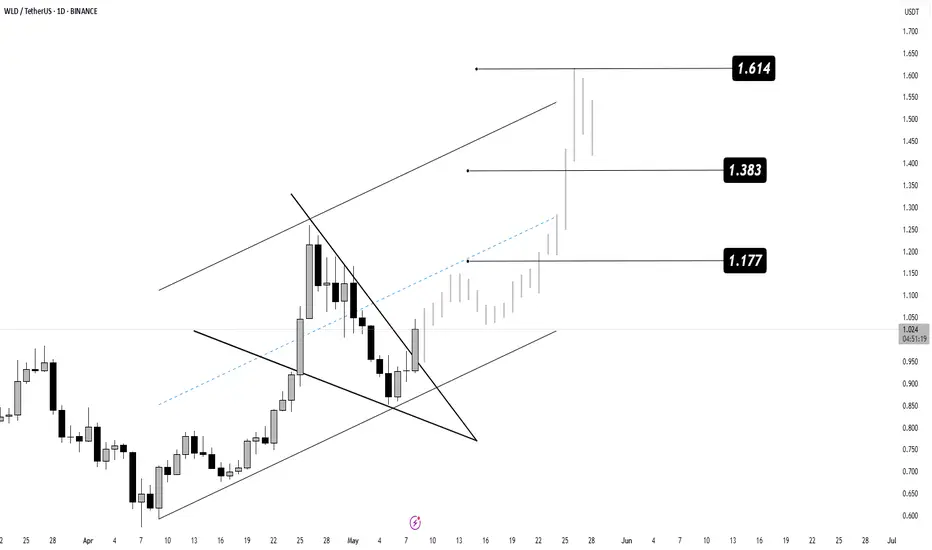
WLD Update NEXT TARGET ??
Worldcoin is currently retesting the descending channel and the 50 MA after a confirmed breakout on the daily chart 🔍
📈 A successful bounce here could send price toward:
🎯 $1.25
🎯 $1.75
🎯 $2.50
Momentum building — keep it on your radar! ⚡️
WLD: The Worldcoin Recovery#WLD endured a tough year from March 2024 until its strong rebound last month, which might lead to shift it's bearish trend.
Maintaining $0.57 is essential, breaking it would lead to new all-time lows.
Passing $4.20 opens the door to $8.50 and possibly new ATHs.
#Worldcoin

WLD Main trend. Super pump +1118 and decline -95. 09 05 2025Logarithm. Main trend. Time frame 3 days.
Super pump +1118.42% and decline -95.16%.
Smart and stupid money. The legend of the project is quite interesting, it is quite possible that there will be attempts to implement it, but always in the first place in such projects is: "money from nothing". The chart confirms this. After the pump +1118.42%, a huge distribution zone, which formed the upper part of the pattern of one of the varieties of "head and shoulders" at an angle. Which makes it clear that the profit is huge. Even now, with a price decrease below the listing prices, from the peak of the pump by -95.16%, which is normal for assets of such liquidity, the profit of some "investors" is +25 X !! Think about what profit was when pumping +1118% (it is impossible to implement, the pump is done just for the chart, to raise the price, for "false goals" and hype, so that on rollbacks "cheap", in the distribution zone they were not afraid to buy on the conditional hype "whales bought". Although now it is unlikely that they will pour. In order to constantly sell at excess profit "at any prices", you need to make interest, both for traders and for investors, that is, volatility waves. They will pump under the market.
Local trend . Local impulse from the minimum prices. Locally, the price rested against the median, in case of its breakthrough - the implementation of the ascending pennant.

WLDUSDT | Strong Buyers SpottedThere’s no denying that WLDUSDT is attracting serious buyer interest. The volume structure and price behavior are both signaling strong hands are quietly accumulating — and that’s usually the precursor to something much bigger.
🔹 The Blue Box – The Area of Interest
While I’m not rushing to jump in at current levels, my eyes are on the blue box. This zone offers the kind of setup I love: a confluence of previous demand, liquidity potential, and a great spot for whales to reload. If price reaches this area, it could be our opportunity to enter with tight risk and high reward.
But like always, I won’t blindly act just because we hit the level. I’ll wait for lower time frame breakouts or strong reactions in this area to confirm that buyers are stepping in again.
🔹 What to Look For Before Entering:
Entry only if we get a bounce or breakout on the 15min–1H timeframe
Volume confirmation (not just a wick)
Clean invalidation levels under the zone for safe risk management
🧠 Why This Approach Works
Most traders either FOMO at the top or try to catch falling knives. But our edge is waiting for the market to come to us, not chasing it. This approach keeps us on the right side of the move and avoids unnecessary emotional decisions.
So yes, I hope we reach the blue box, not because I’m desperate to enter, but because that’s where the trade becomes real. Until then, patience is power.
📌I keep my charts clean and simple because I believe clarity leads to better decisions.
📌My approach is built on years of experience and a solid track record. I don’t claim to know it all but I’m confident in my ability to spot high-probability setups.
📌If you would like to learn how to use the heatmap, cumulative volume delta and volume footprint techniques that I use below to determine very accurate demand regions, you can send me a private message. I help anyone who wants it completely free of charge.
🔑I have a long list of my proven technique below:
🎯 ZENUSDT.P: Patience & Profitability | %230 Reaction from the Sniper Entry
🐶 DOGEUSDT.P: Next Move
🎨 RENDERUSDT.P: Opportunity of the Month
💎 ETHUSDT.P: Where to Retrace
🟢 BNBUSDT.P: Potential Surge
📊 BTC Dominance: Reaction Zone
🌊 WAVESUSDT.P: Demand Zone Potential
🟣 UNIUSDT.P: Long-Term Trade
🔵 XRPUSDT.P: Entry Zones
🔗 LINKUSDT.P: Follow The River
📈 BTCUSDT.P: Two Key Demand Zones
🟩 POLUSDT: Bullish Momentum
🌟 PENDLEUSDT.P: Where Opportunity Meets Precision
🔥 BTCUSDT.P: Liquidation of Highly Leveraged Longs
🌊 SOLUSDT.P: SOL's Dip - Your Opportunity
🐸 1000PEPEUSDT.P: Prime Bounce Zone Unlocked
🚀 ETHUSDT.P: Set to Explode - Don't Miss This Game Changer
🤖 IQUSDT: Smart Plan
⚡️ PONDUSDT: A Trade Not Taken Is Better Than a Losing One
💼 STMXUSDT: 2 Buying Areas
🐢 TURBOUSDT: Buy Zones and Buyer Presence
🌍 ICPUSDT.P: Massive Upside Potential | Check the Trade Update For Seeing Results
🟠 IDEXUSDT: Spot Buy Area | %26 Profit if You Trade with MSB
📌 USUALUSDT: Buyers Are Active + %70 Profit in Total
🌟 FORTHUSDT: Sniper Entry +%26 Reaction
🐳 QKCUSDT: Sniper Entry +%57 Reaction
📊 BTC.D: Retest of Key Area Highly Likely
📊 XNOUSDT %80 Reaction with a Simple Blue Box!
📊 BELUSDT Amazing %120 Reaction!
📊 Simple Red Box, Extraordinary Results
I stopped adding to the list because it's kinda tiring to add 5-10 charts in every move but you can check my profile and see that it goes on..

WLD - GOOD TIME TO SELL AND BUY LOWERGood Morning,
Hope all is well. Another nice bull run with WLD coin! Here we can see that WLD has completed a bull run. It tried to break resistance twice now and has failed, with the 2nd run yielding less volume than desired. This is signifying that WLD will be retesting previous supports before going back up again.
Enjoy!

Worldcoin WLD price analysisSam Altman has officially launched the World ID project in the United States, a digital identity system based on iris scanning.
Users are scanned using the Orb device and receive a digital ID (World ID) and 14 #WLD tokens
Last time then the price of OKX:WLDUSDT has been actively growing , when more than 12 million people from 100+ countries "sold" their "scanned eye" for a reward in #Worldcoin
Do you believe that history will repeat itself and the price of #WLDUSD will rise, at least to $3.75?

WLDUSDTConsidering the positive news about this currency, which has started operating in six American cities and is attracting attention and focus, and from the technical perspective that you can see, I think it is worth the risk and with proper risk and capital management, we can have it in our portfolio.

WLD Bearish Head and Shoulders Pattern ConfirmedWLD Bearish Head and Shoulders Pattern Confirmed 🚨
WLD has formed a bearish head and shoulders pattern and is currently breaking below the red neckline. The target for this bearish move is the green line level.
📈 Technical Overview:
Pattern: Bearish Head and Shoulders
Neckline: Red level, currently being broken.
🎯 Target: Green line level.
.

#WLD/USDT#WLD
The price is moving within a descending channel on the 1-hour frame and is expected to break and continue upward.
We have a trend to stabilize above the 100 moving average once again.
We have a downtrend on the RSI indicator that supports the upward move with a breakout.
We have a support area at the lower boundary of the channel at 1.15, which acts as strong support from which the price can rebound.
Entry price: 1.16
First target: 1.19
Second target: 1.23
Third target: 1.28

WLD/USDTHello friends
Given the price growth we had, the price correction has now managed to make good bottoms, which indicates the strength of the trend, so we can enter the trade.
The purchase and target points have also been identified...
Follow capital management.
*Trade safely with us*

WLDUSDTmy entry on this trade idea is taken from a point of interest above an inducement (X).. I extended my stoploss area to cover for the whole swing as price can target the liquidity there before going as I anticipate.. just a trade idea, not financial advise
Entry; $1.407
Take Profit; $1.216
Stop Loss; $1.467

#WLD/USDT#WLD
The price is moving within a descending channel on the 1-hour frame and is expected to continue upward.
We have a trend to stabilize above the 100 moving average once again.
We have a downtrend on the RSI indicator, which supports the upward move by breaking it upward.
We have a support area at the lower limit of the channel at 0.750.
Entry price: 0.0764
First target: 0.0782
Second target: 0.800
Third target: 0.829

Wldusdt trading ideaWLD initially formed a rising wedge, a well-known bearish reversal pattern, within the External Supply Zone. The break below the wedge triggered a significant drop, pushing price through the Supply Zone before finding support in the Critical Demand Zone, which also aligns with a key Fibonacci retracement level.
Currently, price is developing a falling wedge, a typical bullish reversal structure, suggesting potential upside momentum. A breakout above this wedge could confirm trend reversal, with the first key target around $4.029, aligning with the Supply Zone. If momentum sustains, the next major resistance stands at $11.424, near previous structural highs.
With RSI showing signs of reversal from oversold territory, will this bullish setup play out?

#WLD/USDT#WLD
The price is moving within a descending channel on the 1-hour frame, adhering well to it, and is heading for a strong breakout and retest.
We are seeing a bounce from the lower boundary of the descending channel, which is support at 0.725.
We have a downtrend on the RSI indicator that is about to be broken and retested, supporting the upward trend.
We are looking for stability above the 100 moving average.
Entry price: 0.747
First target: 0.769
Second target: 0.788
Third target: 0.812

TradeCityPro | WLD: Waiting for Reversal in Altman’s Web3 Coin👋 Welcome to TradeCity Pro!
In this analysis, I want to review the WLD coin for you. This project is one of the notable Web3 and Identity projects, founded by Sam Altman, who is also the CEO of OpenAI — and that adds a layer of trust to the project.
🔍 Currently, this coin has a market cap of $984 million, placing it at rank 64 on CoinMarketCap.
📅 Daily Time Frame
As you can see in the daily time frame, the price has dropped significantly since the previous analysis. After breaking below the 1.349 level, the main bearish leg began, and the price fell to the 0.603 area.
🧩 Currently, the price is in a correction phase, moving slowly upward on low volume, and has broken above the SMA25, now trading above this moving average.
🎲 Keep in mind: even though the price is above the SMA25, the slope of the moving average is still downward, which indicates that bearish momentum is still present in the market. However, since the price is now above the SMA, bearish strength is weakening.
📈 To confirm a bullish reversal for WLD, the key trigger right now is the breakout of the 0.947 level. If the price stabilizes above this level, we can say the trend has shifted to bullish.
✔️ A sooner confirmation of the trend change would be a positive slope on the SMA25 combined with increasing volume and green candles — this would be an early sign of a reversal.
🛒 For spot buying, the first trigger is the break of 0.947, and if the price holds above that, the bullish trend could begin.
🔽 The next resistance levels — which could act as targets or secondary buy triggers — are at 1.349 and 2.5776 respectively.
📊 If you already hold this coin and are looking to set a stop-loss, a break and confirmation below 0.603 would be a good level to activate your stop.
📝 Final Thoughts
This analysis reflects our opinions and is not financial advice.
Share your thoughts in the comments, and don’t forget to share this analysis with your friends! ❤️

WLDUSDT 1D AnalysisWLD ~ 1D Analysis
#WLD Mark this coin, and buy when successfully penetrating this resistant line with a short -term target of at least 10%+.

#WLD/USDT#WLD
The price is moving within a descending channel on the 1-hour frame, adhering well to it, and is heading for a strong breakout and retest.
We are experiencing a rebound from the lower boundary of the descending channel, which is support at 0.600.
We are experiencing a downtrend on the RSI indicator, which is about to break and retest, supporting the upward trend.
We are looking for stability above the 100 moving average.
Entry price: 0.640
First target: 0.660
Second target: 0.680
Third target: 0.700

WLDUSDT | Blue Box Resistance Zones – Especially Watch the UpperWLDUSDT is currently navigating a complex structure, and the blue boxes marked on the chart are key resistance zones to pay close attention to. These aren’t just visual markers—these zones reflect areas where sellers are likely to step in based on past reactions and current market behavior.
🔵 Resistance Insight:
The first blue box is a resistance zone, but the upper blue box stands out as a much higher probability area. If price manages to climb up there, it becomes a much more interesting level for potential shorts.
These zones have been picked based on clear behavioral patterns in the market, and if you’ve been following my work, you already know how accurate these selections often turn out to be.
📌 Trading Plan:
I’ll be watching for lower time frame confirmation—whether it’s a breakdown, CDV divergence, or failure to push higher.
If these levels break with volume and retest as support, I’ll flip my bias and look for long entries.
Until then, I’ll stay cautious and let the market do the talking.
🔁 Why Follow These? These levels aren’t random—they come from a strategy refined with precision and backed by high win rates. If you’re tired of guessing and want a more data-backed way to trade, you’re in the right place. Just remember: don’t chase—wait for the setup, trade with confirmation, and manage your risk.
📌I keep my charts clean and simple because I believe clarity leads to better decisions.
📌My approach is built on years of experience and a solid track record. I don’t claim to know it all but I’m confident in my ability to spot high-probability setups.
📌If you would like to learn how to use the heatmap, cumulative volume delta and volume footprint techniques that I use below to determine very accurate demand regions, you can send me a private message. I help anyone who wants it completely free of charge.
🔑I have a long list of my proven technique below:
🎯 ZENUSDT.P: Patience & Profitability | %230 Reaction from the Sniper Entry
🐶 DOGEUSDT.P: Next Move
🎨 RENDERUSDT.P: Opportunity of the Month
💎 ETHUSDT.P: Where to Retrace
🟢 BNBUSDT.P: Potential Surge
📊 BTC Dominance: Reaction Zone
🌊 WAVESUSDT.P: Demand Zone Potential
🟣 UNIUSDT.P: Long-Term Trade
🔵 XRPUSDT.P: Entry Zones
🔗 LINKUSDT.P: Follow The River
📈 BTCUSDT.P: Two Key Demand Zones
🟩 POLUSDT: Bullish Momentum
🌟 PENDLEUSDT.P: Where Opportunity Meets Precision
🔥 BTCUSDT.P: Liquidation of Highly Leveraged Longs
🌊 SOLUSDT.P: SOL's Dip - Your Opportunity
🐸 1000PEPEUSDT.P: Prime Bounce Zone Unlocked
🚀 ETHUSDT.P: Set to Explode - Don't Miss This Game Changer
🤖 IQUSDT: Smart Plan
⚡️ PONDUSDT: A Trade Not Taken Is Better Than a Losing One
💼 STMXUSDT: 2 Buying Areas
🐢 TURBOUSDT: Buy Zones and Buyer Presence
🌍 ICPUSDT.P: Massive Upside Potential | Check the Trade Update For Seeing Results
🟠 IDEXUSDT: Spot Buy Area | %26 Profit if You Trade with MSB
📌 USUALUSDT: Buyers Are Active + %70 Profit in Total
🌟 FORTHUSDT: Sniper Entry +%26 Reaction
🐳 QKCUSDT: Sniper Entry +%57 Reaction
📊 BTC.D: Retest of Key Area Highly Likely
📊 XNOUSDT %80 Reaction with a Simple Blue Box!
📊 BELUSDT Amazing %120 Reaction!
I stopped adding to the list because it's kinda tiring to add 5-10 charts in every move but you can check my profile and see that it goes on..

WLD — Heavy Discount. Long-Term Opportunity on the TableWLD has pulled back over 80% from its previous high — a massive correction that now opens the door for long-term accumulation. The current range looks like a gift for patient players. Don’t sleep on setups like this — they don’t come often.
Follow for more high-conviction plays like this one.
Entry: 0,7-0,71
TP: 1,37-3,35

New bottoms...Targetting fibonacci 1.618 level.
* The purpose of my graphic drawings is purely educational.
* What i write here is not an investment advice. Please do your own research before investing in any asset.
* Never take my personal opinions as investment advice, you may lose your money.

#WLD/USDT#WLD
The price is moving within a descending channel on the 1-hour frame and is expected to continue lower.
We have a trend to stabilize below the 100 moving average once again.
We have a downtrend on the RSI indicator, supporting the upward move with a break above it.
We have a support area at the upper limit of the channel at 0.844.
Entry price: 0.838
First target: 0.828
Second target: 0.809
Third target: 0.789
