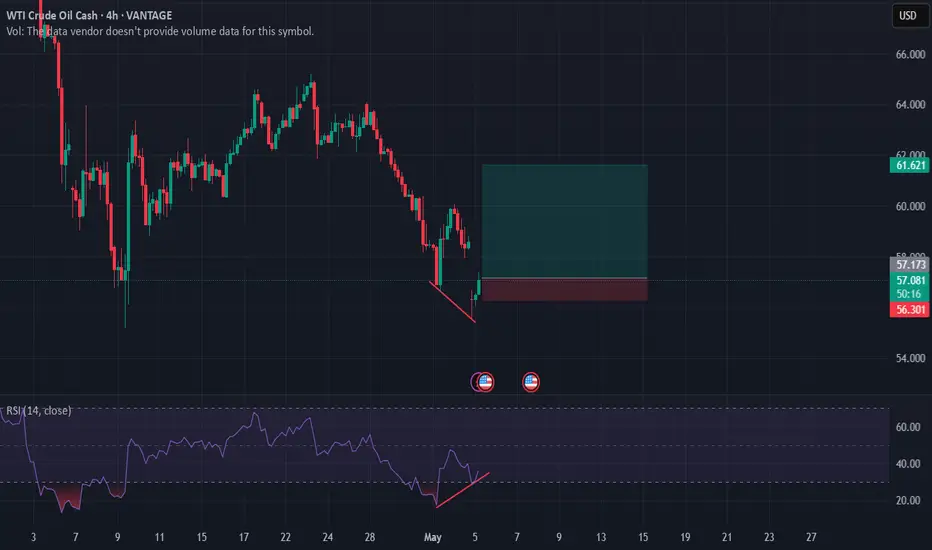
USOIL SHORT SIGNAL|
✅CRUDE OIL made a retest
Of the horizontal resistance level
Of 59.80$ and we are already seeing
A bearish reaction so we are bearish
Biased and we can enter a short trade
With the TP of 58.10$ and the
SL of 59.93$
SHORT🔥
✅Like and subscribe to never miss a new idea!✅
Disclosure: I am part of Trade Nation's Influencer program and receive a monthly fee for using their TradingView charts in my analysis.
WTICOUSD trade ideas

Oil prices still face systemic downside risks.Although the geopolitical situation in the Middle East (the conflict between Israel and Iran) may support oil prices in the short term, market sentiment is still dominated by supply pressure. Technically, WTI has broken below the key support level of $60. The MACD death cross and the oversold RSI suggest that the bears are in the dominant position, and the next support level is expected to be $54.80. Barclays Bank has lowered its price forecast for Brent crude in 2025 to $66. Weak demand and the expectation of the resumption of shale oil production in the United States further suppress the medium - term trend.
you are currently struggling with losses, or are unsure which of the numerous trading strategies to follow, at this moment, you can choose to observe the operations within our channel.
Trading Strategy:
sell@58.8-59.1
TP:57.6-58.1

Short term correction.If within the next hour we close above the previous candle, there will be a good opportunity to go long.
What adjustments will be made to oil prices?If traders don’t know how to trade, they can refer to the strategy of the Swing Trading Center. Earlier, it was announced to sell at 57.24. The lowest price reached around 56.3, and now the oil price has returned to 57.24. How to trade? If you are also confused, you can refer to the views of the Swing Trading Center.
At present, the supply of oil prices exceeds the demand, and some oil-producing countries will continue to increase the production of oil prices. The market has never recognized that oil will become a slow-selling product. Oil prices can be allowed to fall. But oil is not allowed to have no production capacity. I like this sentence.
Oil prices are expected to be mainly adjusted in the short term. The clear trading instructions have been announced in the Swing Trading Center. Stay tuned. Prevent missing good trading opportunities.

Crude oil, still bearishAs global supply increases and macro risks rise, the price downside range reappears. If tensions in the Middle East escalate further, it may cause market volatility. The original trend of rising first and then falling today, after the downhill new low, the rise continued, and there was pressure at 57.7. It is expected that there will be shocks and then declines. The original trend is still in a bearish trend, so we consider shorting as the main. Pay attention to the 57.7 resistance and 55.5 support.

After a period of fluctuation, it will continue to decline.WTI crude oil has recouped part of the decline from the sharp drop at the start of this week. It was quoted at $57.55 per barrel during intraday trading. OPEC+ has unexpectedly increased production again, and WTI crude oil has continued the bearish trend that has gradually taken shape since March. With the increase in global supply and the rise in macro risks, the downward price range has emerged once again. If the tensions in the Middle East escalate further, it may trigger market volatility. The eight core member states of the organization, led by Saudi Arabia, have agreed to increase daily production by 411,000 barrels in June, which is the same as the unexpected production increase in May. The cumulative production increase now exceeds 800,000 barrels per day, marking an important step towards canceling the target of the voluntary production cut of 2.2 million barrels per day that has been promised since 2022. Crude oil showed a trend of rising first and then falling today. After breaking through a new low, the upward movement continued. It faced resistance after reaching
you are currently struggling with losses, or are unsure which of the numerous trading strategies to follow, at this moment, you can choose to observe the operations within our channel.

Oil is Doomed: Time to SELL (Part 2/3)Drill, Baby, Drill & Trump’s Oil Pressure
🇺🇸 Trump’s Oil Agenda
Trump wants cheap oil to bring down inflation and interest rates. His rallying cry? *“Drill, baby, drill.”*
That means: more drilling, more refining, more pipelines → more US oil flooding the global market.
💼 MAGA & Low Oil Prices
Trump believes cheap oil = strong economy . He also wants to pressure OPEC and Saudi Arabia to cut prices as a way to end the Russia-Ukraine war.
Flashback: In 2020, oil went negative ($-40!) when Saudi and Russia ramped production. History may rhyme again.
⚠️ Demand Problems
OPEC, IEA, EIA, Rystad — all lowering demand forecasts for 2025.
Even the most optimistic see demand growth at 1.2 million bpd , down from 1.85.
And that’s before green energy kicks in harder:
🔋 Solar & wind are now cheaper in 96% of the world.
🌍 Renewables are eating into fossil fuel demand.

WTI TRADE IDEAhello everyone
From the previous oil movement, the entry at 58.52 moved up by 80 pips before hitting breakeven. For the upcoming open market, if the trendline and support or resistance break out as shown on the M30 chart, it could signal an opportunity to enter the market.
Ensure strong confirmation before acting, and keep an eye on shifts in market structure.
Thanks a lot for your support & best of luck
**My trading strategy is not intended to be a signal. It's a process of learning about market structure and sharpening my trading my skills also for my trade journal**

Analysis and Layout of Crude Oil at the Opening of the MarketThe international crude oil market has experienced intense fluctuations. Both Brent crude oil and West Texas Intermediate (WTI) crude oil have recorded significant declines, dropping by 8.31% and 7.58% respectively. The expectations of OPEC+ production increase, the trade concerns triggered by Trump, and the market's risk aversion sentiment due to the global economic slowdown have become the key factors dominating the trend of oil prices.
The crude oil has corrected and broken below the support line, and there is a high probability that the bearish trend will enter a further acceleration stage. After the initial rise followed by a fall, the demarcation line between the bulls and the bears is around 59.4. If it comes under pressure again, it will indicate the continuation of the future trend. The moving average system is in a bearish arrangement, and it is suppressed by the 30-day moving average. Objectively, the short-term trend direction remains downward. Next week, consider taking short positions around 59.4 and expect further decline.

Oil to soon hit below $50.0Please ignore that Asia BOX. Besides that oil is coming further down. but trying to fine tune my entry and exit setup. For me this would be a nice good grade setup cuz of L mapping. I think its got more downside to fall. Hope its not too greedy to set that huge of TP but you never know with commodities and expectations run outside of the reality as bigger the TF more inaccurate you shall be.

Summary of the Crude Oil Market This WeekThis week, the crude oil market witnessed a significant decline. Brent crude oil dropped by a cumulative 8.3%, and WTI crude oil fell by 7.5%. Both recorded their largest single-week declines since the end of March.👉👉👉
OPEC+ convened a production meeting ahead of schedule and planned to discuss the production increase plan for June. The market bets that the probability of a production increase is as high as 70%. Previously, OPEC+ unexpectedly announced in April that it would increase daily production by 411,000 barrels starting from May, which is three times the original planned increase. This move aimed to punish member states that had overproduced oil. If production is further increased in June, it will further intensify the supply pressure on the market.
Although the geopolitical tensions in the Middle East region have intensified, such as the postponement of the fourth round of nuclear negotiations between the United States and Iran, which has, to a certain extent, provided support for oil prices, judging from the overall market situation this week, this supporting effect has failed to offset the impact of increased supply and decreased demand.
Overall, this week, under the intertwined influence of factors such as increased supply, uncertain demand prospects, and changes in the geopolitical situation, the crude oil market showed a significant downward trend. The market's expectations for crude oil prices are rather pessimistic, and it is expected that crude oil prices will still face certain downward pressure in the coming period. However, if OPEC+ changes its production increase plan, or if there is an unexpected improvement in the global economy, crude oil prices may rebound.

Shorting XTIUSD Took me 2 years to actually understand trend is your friend and Fib don't lie
Clear short

USOIL trading alerts. Pressure and support.Oil also fell according to instructions. I just forgot to remind you. Sorry, but the profit is quite good. Sell short from 58.7. Then the lowest reached 56.34
But today in the New York market, USOIL rose again above 58. From a fundamental perspective. The market will continue to fall under pressure. But from the trend, we need to pay attention to the support of 58. If it does not fall today, it is likely to continue to fall based on Friday's trend. The pressure level near 59 needs to be paid attention to. In terms of operation, it is still mainly selling at high levels.
Always remind trading risks. So don't ignore this. If you don't know how to trade. Remember to wait and see. Don't trade blindly or gamble.
Many investor friends know that I have led some investors to create good profits for several consecutive days. If you don't know how to trade, remember to leave me a message and try it. Maybe your profit will double.

USOIL... 1D CHART PATTERNHere's my USOIL (WTI Crude) trade setup.
- *Trade Type:* Sell
- *Entry Price:* 57.74
- *Stop Loss (SL):* 65.54
- *Take Profit (TP):* 51.40
*Quick Risk/Reward Analysis:*
- *Risk:* 65.54 - 57.74 = *7.80*
- *Reward:* 57.74 - 51.40 = *6.34*
- *Risk/Reward Ratio:* 6.34 / 7.80 ≈ *0.81*
*Comment:*
This setup has a risk greater than the potential reward, which is not ideal. A better trade usually has a risk/reward ratio of at least 1:1, preferably 1:2 or more. You might consider adjusting your TP or SL, or confirming the direction with technical/fundamental analysis.

WTI Wave Analysis – 29 April 2025
- WTI reversed from the resistance area
- Likely to fall to support level 58.00
WTI crude oil recently reversed from the resistance area between the resistance level 64.60 (former multi-month low from September 2024), the 20-day moving average and the 61.8% Fibonacci correction of the downward impulse from the start of April.
The downward reversal from this resistance started the active short-term impulse wave 5, which belongs to the intermediate impulse sequence from last year.
Given the clear daily uptrend, WTI crude oil can be expected to fall toward the next support level 58.00.

USOIL: Recent Analysis and Trading StrategiesOver the past two weeks, USOIL has been continuously fluctuating and consolidating within the price range of $61.5 - $64.5. The overall trend shows a pattern of rising first and then falling. During the upward phase, the bullish momentum was scarce, making it difficult to achieve an effective breakthrough. Subsequently, it shifted into a downward trend. Yesterday's market situation was particularly typical. It opened higher at $63.5 in the early trading session and then declined all the way. It not only broke below the key support level of $61.5 but also had weak rebound strength. Currently, the price is still hovering around this support level, indicating the market's indecision.
Currently, most investment institutions hold a pessimistic view on the future of USOIL. However, it is worth noting that the price has touched the support level of $61.5 five times in the past two weeks. Although it briefly broke below this level twice, it failed to effectively form a trending breakthrough. The principle that "if a support level can't be broken after repeated attempts, there will be a rebound" has been verified many times in similar situations, suggesting that there may be strong potential buying power at this support level.
Based on the above analysis, today's trading strategy is recommended to maintain a cautiously bearish tone, but it is necessary to closely guard against potential technical rebound risks. During the trading process, it is essential to set stop-loss levels strictly to avoid the expansion of losses due to sudden market movements. At the same time, it is advisable to reduce aggressive trading and mainly adopt a wait-and-see approach. Be patient and wait for clearer trend signals, and then choose the right time to enter the market when the market direction becomes more explicit.
USOIL
sell@62-62.5
tp:61-60.5
sl:62.8
In the future, we will continue to monitor the market changes and update the trading strategies in real time.
I am committed to sharing trading signals every day. Among them, real-time signals will be flexibly pushed according to market dynamics. All the signals sent out last week accurately matched the market trends, helping numerous traders achieve substantial profits. Regardless of your previous investment performance, I believe that with the support of my professional strategies and timely signals, I will surely be able to assist you in breaking through investment bottlenecks and achieving new breakthroughs in the trading field.


The price fluctuation range of USOIL is quite obvious.In the past two weeks, USOIL has been continuously fluctuating within the price range of $61.5 - $64.5. Its trend shows a pattern of rising first and then falling. During the upward phase, there was a slight lack of momentum, and subsequently, it entered a downward channel. This kind of fluctuation is not isolated but has complex underlying causes.
In terms of trading strategies, given that the current price fluctuation range is relatively clear, a strategy of selling high and buying low within the range of $61.5 - $64.5 can be considered. However, it should be noted that once the price breaks through the above-mentioned range, the strategy should be adjusted in a timely manner to follow the market trend, and one should be on guard against the risks brought about by a one-sided market.
USOIL
sell:63.5-64
tp:62.5-62
I am committed to sharing trading signals every day. Among them, real-time signals will be flexibly pushed according to market dynamics. All the signals sent out last week accurately matched the market trends, helping numerous traders achieve substantial profits. Regardless of your previous investment performance, I believe that with the support of my professional strategies and timely signals, I will surely be able to assist you in breaking through investment bottlenecks and achieving new breakthroughs in the trading field.

USOILOil shows price moving between a clear support level and a strong order block resistance above. Currently, price is trading inside a resistance zone around 63.25.
The chart indicates a potential bullish move, targeting the 64.22 level, where the order block resides.
Key Technical Points:
- Support Level: Strong demand area near 62.00.
- FVG (Fair Value Gap): Gap filled below current price.
- Resistance Zone: Price facing resistance around 63.00-63.50.
- Order Block: Major target area near 64.22.
Target Projection: $64.22
Outlook:
If buyers sustain momentum above the resistance zone, we could see a rally toward the 64.22 target at the order block. Confirmation of a breakout and retest would strengthen the bullish bias.
Would you like me to also create a quick short caption for social media posting?

USOIL-crude about to resume lower?WTI formed a large bearish engulfing candle on its daily chart yesterday near the key $65 resistance level. Was that an indication that prices have ended their corrective bounce? Time will tell, but today's oil prices have bounced back. With the trade uncertainty in the background, demand concerns remain high.
So, I wouldn't be surprised if prices were to resume lower from here. The trend is clearly bearish with the moving averages all pointing lower, not to mention the lower highs and lower lows.
If the selling resumes, watch for possible bounces at the next key round handles like $62, $61 and $60. But there is always the possibility of a sweep below this month's earlier lows if macro concerns intensify.
Meanwhile, the bullish idea is off the table for me for now until we see some progress in US-China trade talks at least, or if prices show a major bullish reversal signal.

USIOL: Trading Strategy for Next WeekAfter reaching the key resistance level, USOIL started to decline. In the trading next week, when it reaches the vicinity of the resistance level of $64.5, you can continue to go short.
All the signals I sent have been profitable, and I will continue to send accurate signals.
USOIL Trading Strategy:
usoil sell@64.5-65
tp:63-61

USOIL: Bears Are Winning! Short!
My dear friends,
Today we will analyse USOIL together☺️
The market is at an inflection zone and price has now reached an area around 63.133 where previous reversals or breakouts have occurred.And a price reaction that we are seeing on multiple timeframes here could signal the next move down so we can enter on confirmation, and target the next key level of 62.366..Stop-loss is recommended beyond the inflection zone.
❤️Sending you lots of Love and Hugs❤️
