SILVER (XAGUSD): Great Opportunity to BuyThe price of SILVER formed an important bullish pattern after testing a key daily support level.
I spotted an inverted head and shoulders pattern on hourly chart, with a clear breakout above the horizontal neckline.
It is possible that the price will continue to rise, with the next resistance level at 34.37.
XAGUSD trade ideas

Silver’s Bullish Transition: $50 and BeyondSilver OANDA:XAGUSD FX:XAGUSD TVC:SILVER COMEX:SI1! has completed a multi-decade accumulation phase and is now entering a global bullish supercycle, capable of reshaping the balance of power in the precious metals market. Below is the current view across timeframes, structures, and macro drivers.
🔭 Global Perspective
Since the early 1980s, silver has been moving within a broad corrective structure, with two major corrections: from 1980 to 1995 and from 2011 to 2020.
Now there is strong evidence that a transition phase — wave (III) — has begun, which could potentially break historic highs and push prices toward $100+.
Upon reaching the $50 mark, the chart would complete a classic institutional "cup with handle" pattern, similar to gold, potentially triggering an exponential rally.
⏱ Mid-Term View
Since August 2022, silver has been developing an impulsive structure.
The deep correction we observed in April 2025 likely represents wave C of a flat correction, completing wave (4) of the current impulse.
Currently, silver is building wave (5). Within it, the first subwave (i) has either been completed or is still forming.
In the coming weeks or month, a local pullback is possible, followed by a continuation of the bullish rally, with a medium-term target in the $42–50 range.
🌐 Macro and Fundamental Drivers of Growth:
📈 Inflation and declining real interest rates — Silver, like gold, acts as an inflation hedge, especially during periods of monetary easing.
💵 Weakening U.S. Dollar — A falling DXY and potential QE strengthen demand for silver.
⚙️ Growing industrial demand — Silver is essential for solar panels, electronics, electric vehicles, and the medical sector.
🌍 Green energy transition — Silver is a critical material for photovoltaic technologies and the expansion of renewable energy.
📉 Structural supply deficit — Declining mining investment and ore grades are forming a long-term supply shortage.
🏦 Increasing institutional interest — ETFs, hedge funds, and banks are expanding their exposure to silver, boosting liquidity and long-term price support.
⚠️ Geopolitical risks — Metals act as a safe-haven amid rising global instability and de-dollarization trends.
📌
The supercycle is intact — we are likely within wave (III).
Short-term corrections are possible, but the overall structure remains bullish.
Medium-term target — $42–50.
The full cycle may take years, but the directional bias is clear.
Fundamental factors strongly support the technical outlook, pointing to significant long-term upside.

Silver Analysis: Bearish Continuation Toward $31 Support ?🧠 Chart Context & Setup
Chart Type: Candlestick
Timeframe: Likely 4H or Daily
Indicators Used:
EMA 50 (Red) — 32.814
EMA 200 (Blue) — 32.559
🔍 Key Technical Levels
Resistance Zone: 33.600 – 33.950
Price faced repeated rejection in this zone, confirming it as a valid supply/resistance area.
Support Zone: 30.600 – 31.100
Marked as the next potential demand zone, aligning with previous accumulation and reaction levels.
Current Price: ~32.618
Just below the 50 EMA and slightly above the 200 EMA.
🔄 Market Structure
The market experienced a strong bearish impulse in early April, followed by a bullish correction that reclaimed the 200 EMA.
Multiple internal liquidity (INT.LQ) sweeps were taken before forming a potential lower high (LH) at the resistance zone.
The recent bearish move broke below the EMAs and previous structure, indicating a possible shift back to bearish momentum.
📉 Bearish Scenario Outlook (Most Probable as of Now)
The chart shows a projected lower high formation, likely leading into a continuation of the bearish move.
If price fails to break back above 32.800–32.900, we could expect a sell-off toward the support zone (30.600–31.100).
This move aligns with:
Breakdown below EMAs
Failed bullish continuation
Rejection from a strong resistance zone
🧭 EMA Analysis
EMA 50 > EMA 200, but the price is now sandwiched and showing signs of weakness.
If price sustains below both EMAs, momentum is likely to favor bears in the short to medium term.
⚠️ Risk Factors to Watch
Any strong bullish engulfing candle reclaiming the 33.000 zone could invalidate the bearish thesis.
Fundamentals like USD volatility, inflation data, or geopolitical tension could impact Silver drastically.
✅ Conclusion
The chart currently suggests a bearish continuation setup, with the potential for price to revisit the $31.00–$30.60 support zone after rejecting resistance. A retest of broken structure around 32.700–32.800 might provide an ideal entry for sellers.

Silver uptrend channelSilver respecting this uptrend channel very nicely. maybe a retest of the lows before a nice move to the upper level.

Evening Star Pattern on XAGUSD – Downtrend Ahead?Last week, XAGUSD managed to break above the 33.15 resistance level, making a local high at 33.70.
However, the price quickly reversed and formed an Evening Star candlestick pattern, signaling selling pressure.
At the time of writing, the price is hovering around 33.00 – a key pivot point for the next move.
The bias leans toward a downside continuation:
- A clear break below 33.00 opens the way for a further drop toward 32.00,
- With a potential final target at 31.00.
Disclosure: I am part of Trade Nation's Influencer program and receive a monthly fee for using their TradingView charts in my analyses and educational articles.

SILVER HIGHER.What I see on XAGUSD. I have been quite bullish on this and am interested in engaging in a long position around here.
Easiest trade for you guys.

SILVER - BEARISH SCENARIOHello Traders !
The Silver price failed to create a new higher high !
Let's expect the bearish scenario:
If the market breaks the higher low and closes below that,
We will see a bearish move📉
TARGET: 31.23🎯

SILVER WILL GROW|LONG|
✅SILVER made a retest of
The horizontal support area
Around 32.75$ while trading
In an uptrend and we are now
Seeing a bullish rebound
Which reinforces our bullish
Biased and we will be expecting
A further bullish move up
LONG🚀
✅Like and subscribe to never miss a new idea!✅
Disclosure: I am part of Trade Nation's Influencer program and receive a monthly fee for using their TradingView charts in my analysis.

SILVER Set To Grow! BUY!
My dear subscribers,
My technical analysis for SILVER is below:
The price is coiling around a solid key level - 32.014
Bias - Bullish
Technical Indicators: Pivot Points Low anticipates a potential price reversal.
Super trend shows a clear buy, giving a perfect indicators' convergence.
Goal - 32.660
My Stop Loss - 31.682
About Used Indicators:
By the very nature of the supertrend indicator, it offers firm support and resistance levels for traders to enter and exit trades. Additionally, it also provides signals for setting stop losses
Disclosure: I am part of Trade Nation's Influencer program and receive a monthly fee for using their TradingView charts in my analysis.
———————————
WISH YOU ALL LUCK

SILVER: Target Is Up! Long!
My dear friends,
Today we will analyse SILVER together☺️
The market is at an inflection zone and price has now reached an area around 32.356 where previous reversals or breakouts have occurred.And a price reaction that we are seeing on multiple timeframes here could signal the next move up so we can enter on confirmation, and target the next key level of 32.538.Stop-loss is recommended beyond the inflection zone.
❤️Sending you lots of Love and Hugs❤️

Silver Holds Above Key Breakout Zone: Bullish Momentum ContinuesSilver is trading above the former resistance zone of 32.65–32.80. As long as the price remains above this area, I will be considering only long positions.
Overall, I expect the upward movement to continue. The chart structure is very harmonious, with strong buying from the lows, a supportive broader market sentiment for commodities, and a clear uptrend on higher timeframes.

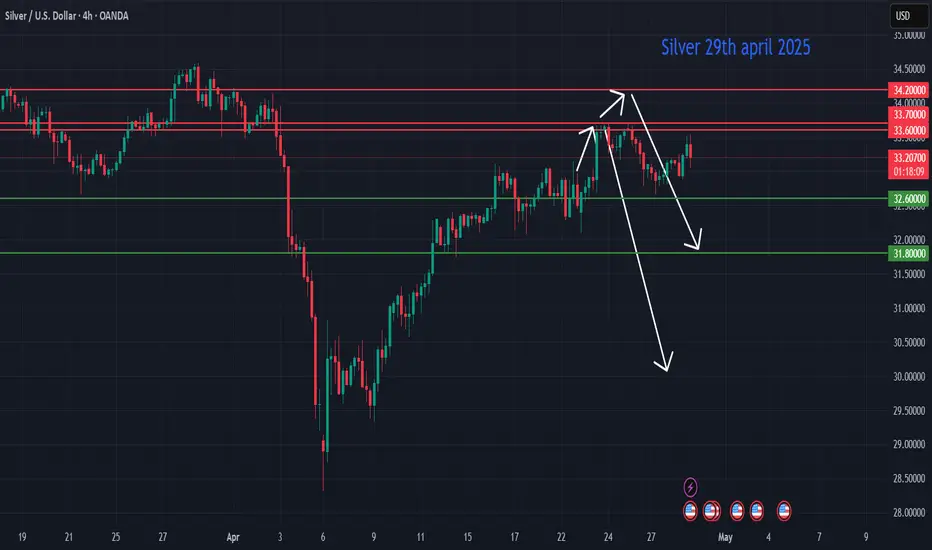
Silver Price Forecast Update (April 29, 2025): Eyeing Fresh SellSilver Price Forecast Update (April 29, 2025): Eyeing Fresh Sell Opportunities Near $34.20
Following our earlier forecast on April 22, 2025 — where we highlighted a retest and potential reversal at the $33.60 level, which was successfully fulfilled — we now turn our attention to the next critical price region. As price action unfolds, I will be closely monitoring the $34.20 area for potential short (sell) setups, contingent on price behavior and broader market confirmation.
🔍 Technical Outlook
Resistance Zone at $34.00–$34.20: This area has previously acted as a strong resistance zone, marking a significant swing high from March 2024. A confluence of Fibonacci extensions (specifically the 127.2% extension from the January–March leg) also aligns here.
Bearish Divergence on RSI (4H and Daily): As silver approaches $34.20, momentum indicators are beginning to show early signs of bearish divergence, suggesting that upside strength may be waning.
Rising Channel Breakdown in Sight: Price remains within an ascending channel since mid-March, but a test and failure near $34.20 could trigger a breakdown, targeting support at $32.60 and potentially $31.80 in extension.
🏦 Fundamental Drivers to Watch
Fed Policy Outlook: Recent Fed commentary continues to lean hawkish, with inflation data remaining sticky. The possibility of delayed rate cuts is strengthening the U.S. dollar and raising real yields — both traditionally bearish factors for silver.
Geopolitical Uncertainty & Safe Haven Flows: On the flip side, ongoing geopolitical tensions in Eastern Europe and the Middle East are contributing to periodic safe haven bids for precious metals. However, these flows have largely benefited gold more than silver in recent sessions.
Industrial Demand Concerns: Slowing global manufacturing PMI readings — especially from China and Germany — are raising concerns about silver’s industrial demand side. This could weigh on the metal in the coming weeks if macroeconomic softness persists.
📈 Trade Plan
I will be closely watching for bearish confirmation patterns near the $34.00–$34.20 resistance zone, such as:
Rejection wicks on the 4H/daily timeframe
Bearish engulfing or pin bar formations
Breakdown below local support levels near $33.50
If confirmed, I will consider initiating short positions, with targets around:
First Target: $32.60
Second Target: $31.80
Stop-Loss: Above $34.50 (structure-based)
📝 Conclusion: While silver continues to enjoy broad bullish momentum, technical resistance at $34.20 could serve as a turning point. Combined with shifting macroeconomic narratives, this level offers a high-reward zone to look for potential reversal and short opportunities, provided the right confirmation signals develop.
Stay tuned — I’ll provide further updates as price action evolves.
SILVER INTRADAY consolidation supported at 3200Key Support and Resistance Levels
Resistance Level 1: 3300
Resistance Level 2: 3364
Resistance Level 3: 3405
Support Level 1: 3200
Support Level 2: 3136
Support Level 3: 3095
This communication is for informational purposes only and should not be viewed as any form of recommendation as to a particular course of action or as investment advice. It is not intended as an offer or solicitation for the purchase or sale of any financial instrument or as an official confirmation of any transaction. Opinions, estimates and assumptions expressed herein are made as of the date of this communication and are subject to change without notice. This communication has been prepared based upon information, including market prices, data and other information, believed to be reliable; however, Trade Nation does not warrant its completeness or accuracy. All market prices and market data contained in or attached to this communication are indicative and subject to change without notice.

Correction Within the Trend — Silver Update📉 Silver — Correction in Wave (ii)
After a strong impulse from April 7 to 25, silver is now in a wave (ii) correction. These second waves are often sharp, but we’re entering a promising long zone between 30.7–31.7.
🔍 A potential reaction may come from the vWap, VAL, or the 0.38 Fib imbalance area.
🧭 This setup fits perfectly into my broader outlook on silver — read the full breakdown here:
👉
📈 The target for the third wave remains around $35+.

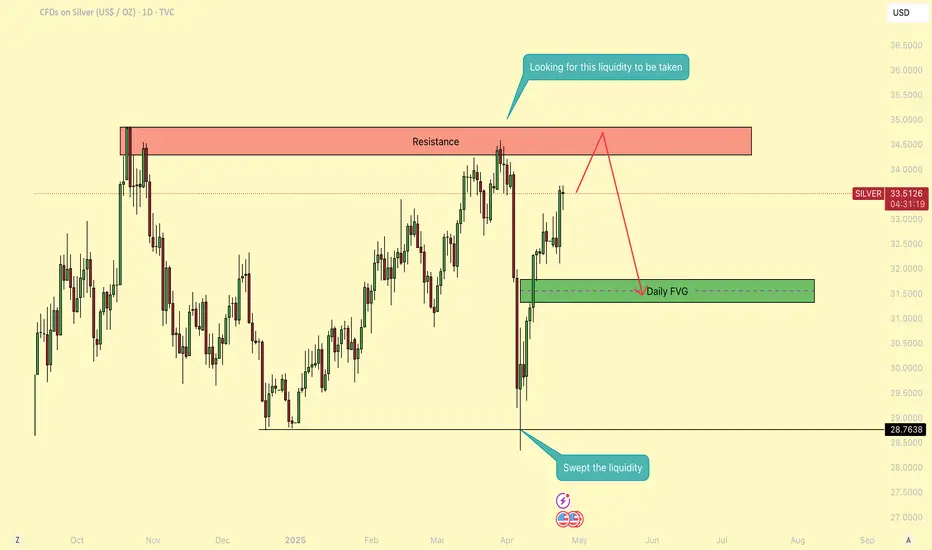
Silver - Is Silver ready to explode to the upside? Since the end of October, the price of silver has been trading within a relatively tight consolidation range, fluctuating between $35 and $28.50. This range has now been tested multiple times on both ends, with the price touching the upper resistance and lower support levels twice, creating a well-defined horizontal structure in the market.
During the most recent decline, silver broke below the $28.50 support, sweeping the previous low and triggering a liquidity grab. This move likely cleared out stop-loss orders positioned beneath that level, providing the necessary fuel for a strong reversal. Following this sweep, the price reacted sharply and began climbing, indicating a shift in momentum and a potential change in market structure.
Currently, silver is accelerating toward the upper boundary of the range, once again approaching the $35 resistance level. Given the previous behavior and the speed of the current move, I anticipate that the price may attempt to sweep the highs above $35, targeting the liquidity resting just above that resistance zone. A rejection from this level is possible, especially considering the presence of a daily Fair Value Gap (FVG) that was left behind during the recent bullish push. If the price pulls back into this FVG and finds support there, it could provide a healthy retracement and set the stage for a more sustained move higher in the medium term.
Overall, the market seems to be positioning itself for a breakout attempt, but the reaction around the $35 level will be crucial in determining whether silver continues upward or enters another phase of consolidation.
If silver manages to break above the $35 resistance and establish support above that level, it could mark a significant shift in market sentiment and open the door for further upside. Holding above this key threshold would likely confirm the breakout from the long-standing consolidation range, signaling strong bullish intent. In such a scenario, we could see increased momentum as sidelined buyers step in, targeting higher levels in the weeks to come.
Thanks for your support.
- Make sure to follow me so you don't miss out on the next analysis!
- Drop a like and leave a comment!
Potential bearish drop?The Silver (XAG/USD) has rejected off the pivot and could drop to the 1st support which acts as a pullback support.
Pivot: 33.12
1st Support: 32.16
1st Resistance: 33.67
Risk Warning:
Trading Forex and CFDs carries a high level of risk to your capital and you should only trade with money you can afford to lose. Trading Forex and CFDs may not be suitable for all investors, so please ensure that you fully understand the risks involved and seek independent advice if necessary.
Disclaimer:
The above opinions given constitute general market commentary, and do not constitute the opinion or advice of IC Markets or any form of personal or investment advice.
Any opinions, news, research, analyses, prices, other information, or links to third-party sites contained on this website are provided on an "as-is" basis, are intended only to be informative, is not an advice nor a recommendation, nor research, or a record of our trading prices, or an offer of, or solicitation for a transaction in any financial instrument and thus should not be treated as such. The information provided does not involve any specific investment objectives, financial situation and needs of any specific person who may receive it. Please be aware, that past performance is not a reliable indicator of future performance and/or results. Past Performance or Forward-looking scenarios based upon the reasonable beliefs of the third-party provider are not a guarantee of future performance. Actual results may differ materially from those anticipated in forward-looking or past performance statements. IC Markets makes no representation or warranty and assumes no liability as to the accuracy or completeness of the information provided, nor any loss arising from any investment based on a recommendation, forecast or any information supplied by any third-party.

Silver H4 I Bearish Reversal Based on the H4 chart, the price is rising toward our sell entry level at 32.46, a pullback resistance.
Our take profit is set at 31.50, a pullback support that aligns with the 50% Fibo retracement.
The stop loss is set at 33.15, an overlap resistance.
High Risk Investment Warning
Trading Forex/CFDs on margin carries a high level of risk and may not be suitable for all investors. Leverage can work against you.
Stratos Markets Limited (tradu.com):
CFDs are complex instruments and come with a high risk of losing money rapidly due to leverage. 63% of retail investor accounts lose money when trading CFDs with this provider. You should consider whether you understand how CFDs work and whether you can afford to take the high risk of losing your money.
Stratos Europe Ltd (tradu.com):
CFDs are complex instruments and come with a high risk of losing money rapidly due to leverage. 63% of retail investor accounts lose money when trading CFDs with this provider. You should consider whether you understand how CFDs work and whether you can afford to take the high risk of losing your money.
Stratos Global LLC (tradu.com):
Losses can exceed deposits.
Please be advised that the information presented on TradingView is provided to Tradu (‘Company’, ‘we’) by a third-party provider (‘TFA Global Pte Ltd’). Please be reminded that you are solely responsible for the trading decisions on your account. There is a very high degree of risk involved in trading. Any information and/or content is intended entirely for research, educational and informational purposes only and does not constitute investment or consultation advice or investment strategy. The information is not tailored to the investment needs of any specific person and therefore does not involve a consideration of any of the investment objectives, financial situation or needs of any viewer that may receive it. Kindly also note that past performance is not a reliable indicator of future results. Actual results may differ materially from those anticipated in forward-looking or past performance statements. We assume no liability as to the accuracy or completeness of any of the information and/or content provided herein and the Company cannot be held responsible for any omission, mistake nor for any loss or damage including without limitation to any loss of profit which may arise from reliance on any information supplied by TFA Global Pte Ltd.
The speaker(s) is neither an employee, agent nor representative of Tradu and is therefore acting independently. The opinions given are their own, constitute general market commentary, and do not constitute the opinion or advice of Tradu or any form of personal or investment advice. Tradu neither endorses nor guarantees offerings of third-party speakers, nor is Tradu responsible for the content, veracity or opinions of third-party speakers, presenters or participants.

Bearish drop?The Silver (XAG/USD) has rejected off the pivot and could drop to the pullback support.
Pivot: 33.12
1st Support: 32.19
1st Resistance: 33.67
Risk Warning:
Trading Forex and CFDs carries a high level of risk to your capital and you should only trade with money you can afford to lose. Trading Forex and CFDs may not be suitable for all investors, so please ensure that you fully understand the risks involved and seek independent advice if necessary.
Disclaimer:
The above opinions given constitute general market commentary, and do not constitute the opinion or advice of IC Markets or any form of personal or investment advice.
Any opinions, news, research, analyses, prices, other information, or links to third-party sites contained on this website are provided on an "as-is" basis, are intended only to be informative, is not an advice nor a recommendation, nor research, or a record of our trading prices, or an offer of, or solicitation for a transaction in any financial instrument and thus should not be treated as such. The information provided does not involve any specific investment objectives, financial situation and needs of any specific person who may receive it. Please be aware, that past performance is not a reliable indicator of future performance and/or results. Past Performance or Forward-looking scenarios based upon the reasonable beliefs of the third-party provider are not a guarantee of future performance. Actual results may differ materially from those anticipated in forward-looking or past performance statements. IC Markets makes no representation or warranty and assumes no liability as to the accuracy or completeness of the information provided, nor any loss arising from any investment based on a recommendation, forecast or any information supplied by any third-party.

Silver has lost 96% of its value...Over 125 years, silver has lost 96% of its value against the stock market.
However, there are some impressive bull markets along the way where this can reverse.
You can spot this using technical analysis.


XAGUSD (Silver/US Dollar) trading idea for Monday, May 5, 2025 Trading Plan (Scenario-Based):
📌 Plan A: Bullish Breakout Play
Entry: Buy on breakout above $26.70 with strong volume confirmation.
SL: $26.20
TP1: $27.10
TP2: $27.50
RRR: ~2.5:1
📌 Plan B: Range Bounce
Entry: Buy near $25.80–26.00 support zone if price retraces.
SL: $25.50
TP1: $26.50
TP2: $26.90

XAGUSD - SILVERSupport and Resistance clearly defined in the chart.
2 Scenarios on my mind is as follows:
Short Term:
Silver Drops to 32 (rounding), where there is a strong long time support for that area. and Target 1 "T1" is at 33.677 (33.600)
Where Long Term due to the lagging effect from gold, long term outlook is heading towards the 34.134 "T2" and 34.578 "T3" and settle there till it moves up again.

SILVER BEARISH BIAS RIGHT NOW| SHORT
SILVER SIGNAL
Trade Direction: short
Entry Level: 3,321.1
Target Level: 3,263.1
Stop Loss: 3,359.8
RISK PROFILE
Risk level: medium
Suggested risk: 1%
Timeframe: 2h
Disclosure: I am part of Trade Nation's Influencer program and receive a monthly fee for using their TradingView charts in my analysis.
✅LIKE AND COMMENT MY IDEAS✅
