Correction upside at 3310!XAUUSD H1&H4 Timeframe .
Market is moving on Falling wedge after the break of break 3320-3340 Accumulation zone.
- I am expecting the upside move to respect the 3310 -3320 resistance area where we must have H4 closing below for bearish moves towards 3230 again .
-if the H4 Candle closed below 3270 then upside Retracement willbe postponed.
- above 3320 again we have Accumulation zone 3320-3360
Enteries should be taken all the rules are applied
XAUUSD trade ideas


GOLD Weekly Open Analysis:Gap Down Sparks Fresh Bearish Momentum🟠 GOLD (XAU/USD) – Weekly Open Analysis: Gap Down Sparks Fresh Bearish Momentum
Gold opens the week with a sharp gap-down, reflecting a cooling of global tensions and softer tones in tariff negotiations over the weekend. With both geopolitical risks and trade conflicts showing signs of de-escalation, investors quickly shifted away from safe-haven demand, leading to immediate downside pressure in early Asia hours.
🔍 Market Context:
The price action remains within a bearish parallel channel on the M30 timeframe.
A visible GAP ZONE has formed between $3326 – $3328, which now acts as a key resistance area to watch for a potential retest.
This week brings critical US economic data including CPI, PPI, and a Fed speech, all of which could drive large volatility.
The market is likely to remain extremely sensitive to any shifts in:
US inflation expectations
FED forward guidance
Further headlines on tariffs or geopolitical escalations (Russia–Ukraine, India–Pakistan)
🔧 Trading Strategy for Today (13/05/2025):
Bias: Short-term bearish unless clear reversal signs appear.
Primary focus: Sell the rally, especially near key resistance zones.
🔺 Key Resistance Levels:
$3288
$3308
$3326–$3328 (Gap Fill Zone)
🔻 Key Support Levels:
$3262
$3246
$3236
$3200
🎯 Trade Ideas:
🔵 BUY ZONE:
Entry: $3246 – $3244
SL: $3240
TPs: $3250 → $3254 → $3258 → $3262 → $3266 → $3270 → $3280
Valid only if buyers show strong defense at key support zones.
🔴 SELL ZONE (Main):
Entry: $3326 – $3328
SL: $3332
TPs: $3322 → $3318 → $3314 → $3310 → $3305 → $3300
🔴 SELL SCALP (Early Intraday):
Entry: $3306 – $3308
SL: $3312
TPs: $3300 → $3296 → $3290 → $3286 → $3282 → $3278 → $3270
⚠️ Key Reminders:
Volatility is expected to remain high throughout the week due to macro events and shifting risk sentiment.
Trade with discipline — stick to your TP/SL and avoid emotional entries.
Wait for confirmation at your planned levels. Let the market come to you.
📣 Final Note:
This week is packed with catalysts. Patience and precision will define successful trades. Follow this account for real-time updates as the market reacts to US CPI and Fed commentary.

Gold operation strategyJudging from the current gold trend, pay attention to the 3206-3215 support line on the downside, with a focus on the 3200 support line. Pay attention to the 3260-65 short-term resistance on the upside, and strong resistance near the 3275-3281 level. This position is also the watershed between the strength of bulls and bears. Before the daily level breaks through and stands at this position, the main short rhythm of the pullback will continue to remain unchanged.

Gold Rally Running Out of Steam? PRZ May Trigger Drop!Gold ( OANDA:XAUUSD ) has hit the targets as I shared with you in yesterday's idae . Will this uptrend of the past 5-6 days continue?
Gold seems to have broken through the Resistance zone($3,387-$3,357) and has been moving in an Ascending Channel for the past 5 days .
In terms of Elliott Wave theory , Gold appears to be completing microwave 5 of the main wave 3 . The end of the main wave 3 can be at the Potential Reversal Zone(PRZ) .
Also, expect to see a clear Regular Divergence(RD-) between Consecutive Peaks at the Resistance zone($3,434-$3,406) .
I expect Gold to start declining from the Potential Reversal Zone(PRZ) and at least to the lower line of the ascending channel . This analysis is against the main trend, so pay more attention to money management .
Note: If Gold touches $3,448(Stop Loss(SL)), we can expect more pumps.
Note: If Gold falls below $3,342, we can expect a deeper decline than expected.
Gold Analyze ( XAUUSD ), 1-hour time frame.
Be sure to follow the updated ideas.
Do not forget to put a Stop loss for your positions (For every position you want to open).
Please follow your strategy; this is just my idea, and I will gladly see your ideas in this post.
Please do not forget the ✅' like '✅ button 🙏😊 & Share it with your friends; thanks, and Trade safe.

Gold (XAU/USD) 3H Chart Analysis – Bullish Setup Toward $3,500 TCurrent Price: $3,254.26
EMA 70: $3,285.50 (Price is below EMA – cautious zone)
Bias: Bullish 📈 (if demand zone holds)
Key Zones:
🟦 Demand Zone: $3,200 – $3,260
✅ Strong buy interest expected here
⚠️ Good place to look for entry signals
🟥 Resistance Zone: $3,223.60 – $3,323.84
🔄 Price is currently testing this zone
A breakout here can lead to bullish momentum
🎯 Target Point: $3,500 – $3,529 💰
📌 Defined as "Target Point 3500"
High potential for profit-taking here
⛔ Stop Loss: $3,161.32
🚫 Placed below demand zone for risk control
❗ Important to exit if price drops here
Trade Idea 💡
📥 Buy Entry: Near or above $3,223.60
✅ Hold as long as price respects demand zone
🎯 Target: $3,500
⛔ Stop Loss: $3,161.32
⚖️ Risk:Reward ratio looks favorable!
Quick Summary:
🟢 Bullish Setup
💪 Demand zone is strong
📈 Breakout above resistance may fuel a rally
⏳ Wait for confirmation before entry!

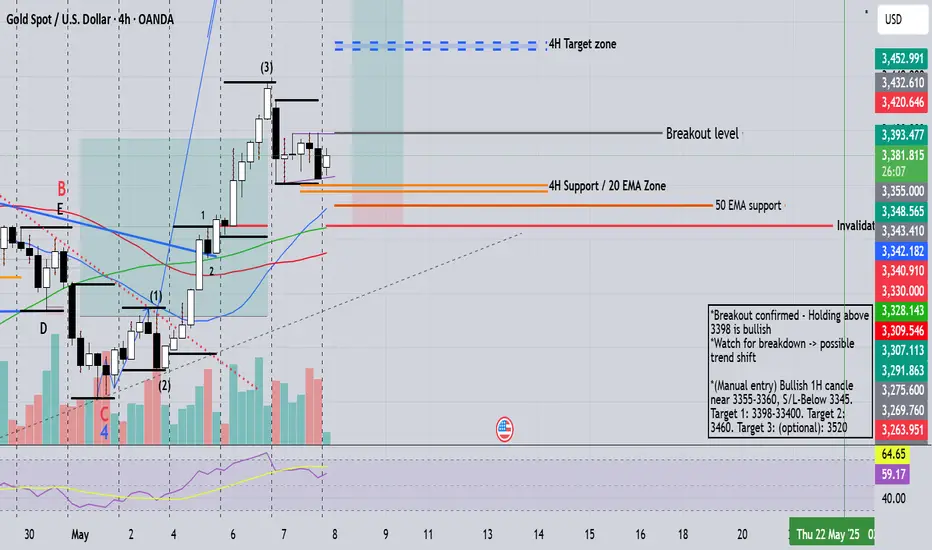
Gold looks bullish at the current level. 1.The chart is showing a series of higher highs and higher lows, indicating an overall uptrend.
2. *Price is above the 20-day MA - Typically a bullish signal.
* (50-day and 89-day MA) are trending upwards and far below the current price, reinforcing a longer-term bullish trend.
Recent Candlestick Action: A strong bullish candle recently bounced off the blue MA after a short consolidation, suggesting buyers stepped in to the pullback. The last candles shows upward momentum resuming, possibly forming a Bullish continuation pattern. The RSI seems to be trending slightly down or flat not yet in overbought territory.
The technicals favor further upside in the short term to medium term, especially if the recent bullish candle closes strong. A break above the recent highs would confirm continuation, while a failure there could mean a short-term pullback.
After the late- April peak and pullback, the market formed a higher low, followed by a strong bullish rally from May 3rd onward. Current candles are consolidating after a sharp move - showing healthy digestion of gains. No strong bearish reversal patterns are visible yet.
Volume increased during the May 3-6 rally - a good sigh of strength behind the move. Slight decrease in volume on the latest candles, suggest consolidation rather than distribution.
RSI is rising but not yet in overbought territory - Room for upside remains. Watch if RSI diverge while price pushes up - that could signal exhaustion.
Warning sign : Drop below 2240 and break below EMAs would shift bias neutral to bearish.
4h Price Structure : after forming a double bottom or rounded base near April 30 - May 2, price pushed up strongly. It`s now consolidating just under the recent highs, forming a bullish flag or tight range, suggesting a potential breakout.
Risk Level To Watch: A break below 3345 (near the 59 EMA and previous range) would invalidate this short-term target and signal weakness.
Can we continue to go long on gold now?Gold has an obvious double bottom structure at the bottom, and gold has an obvious bottom signal near 3210
Trading ideas: Buy gold near 3238, stop loss 3220, target 3270

GOLD RISKY SHORT|
✅GOLD keeps growing
While trading in an uptrend
So we are bullish biased long-term
But the price is about to retest
A local horizontal resistance
Of 3370$ from where we will
Be expecting a local pullback
But we advise you to use low
Risk because it is
A counter-trend trade
SHORT🔥
✅Like and subscribe to never miss a new idea!✅
Disclosure: I am part of Trade Nation's Influencer program and receive a monthly fee for using their TradingView charts in my analysis.

Gold maintains gains near new record highsTechnically, gold's recent rally was remarkably rapid, in search of 3,420 and 3,500, leaving few clear entry points for new buyers. Now, with prices slightly correcting, traders may see this as a potential opportunity for a comeback. The 3,350-3,360 area stands out as a critical support zone. If prices remain above this area, the market may consolidate before attempting to move toward its recent highs. However, a break above this area could lead gold to test 3,330, a pivotal technical support level that could serve as a starting point or signal the beginning of a deeper correction.

XAUUSD sell signal Gold opened the week under pronounced selling pressure, with princes slipping back to the $3,200 mark per troy ounce. The decline was largely attributed to a broad improvement in risk sentiment following news that the US and China had reached an agreement to substantially reduce and temporarily suspend reciprocal tariffs.
XAUUSD signal sell 3238
Support 3214
Support 3194
Support 3176
Resistance 3275

XAUUSD GOLDGold has recently shown bearishness throughout yesterday. bearish scenario and targets are as shown in analysis.
comment bellow your questions I will try to answer ASAP...

Gold: Will rise again after retesting support🎉 Congratulations to everyone who followed the signal and locked in solid profits!
The price moved as expected — long positions hit target smoothly.
📌 Key Range to Watch Next:
Support: around 3246-3238
Resistance: around 3278-3286
✅ Consider trading within this range for short-term opportunities. Use a buy low, sell high strategy unless a breakout or breakdown occurs.

Bullish Continuation Above $3300Hello, traders
GOLD has gone through a deep retracement in a very strong bullish trend! Currently price is trading below the resistance zone marked on the chart.
If GOLD regains and sustains the $3300 mark we are very likely to retest or even put in a new all time high!

Gold Spot vs U.S. Dollar (XAU/USD) on 1H.This chart is an analysis of the Gold Spot price (XAU/USD) on a 1-hour timeframe. Here's the breakdown:
Key Zones and Levels:
Entry Zone (highlighted in orange and red):
This is the area where the trader expects price to pull back before continuing downward.
It's marked as a potential sell zone or resistance area.
The Stop Loss (SL) at $3,301.500.
Target Level:
The expected move is bearish (downtrend).
Arrows indicate a move down toward the Take Profit (TP) target at around $3,203.000.
Trade Idea:
Type: Sell/Short
Plan:
Wait for price to enter the Entry Zone.
Enter a short trade within this zone.
Place Stop Loss above the zone at $3,301.500.
Target a move down to $3,203.000.

Buy on xauusdGold currently testing a 1hour OB,if it respects it ,we should expect a pump.However if it breaks it,I'll be waiting for price to hit the daily resistance where I'll keep a close lookout for a 4hr reversal pattern to kick off the bullish trend...

Gold Intraday Trading Plan 5/13/2025Gold has broken 3270 support and went down all the way to 3208 yesterday. With current strong bearish momentum, I will be very cautious in buying. Therefore, I am looking for selling opportunities from either 3270 resistance or broken of 3200, targeting 3165.
However, if 3270 is broken, the above setup is invalidated. We may have bulls regain its momentum.

XAUUSD Price Outlook – Bearish Setup in Play ??Asset Overview
The chart represents a price action analysis with support and resistance zones, along with EMA indicators (50 and 200), likely on a 4H or 1H timeframe.
Key Technical Levels
Resistance Zone: ~3,400 to 3,450
First Support Zone: ~3,230 to 3,250
Second Support Zone: ~3,090 to 3,130
Indicators
EMA 50 (Red): Currently around 3,340, acting as dynamic resistance.
EMA 200 (Blue): Positioned near 3,232, reinforcing the first support zone.
Price Action Insight
Price had a strong uptrend, peaking above 3,440 before pulling back.
A lower high may be forming, suggesting possible trend exhaustion.
The current bounce appears to be a retracement back toward resistance or EMA 50.
Projected Move (As Illustrated on Chart)
Short-term bullish move into the resistance zone (~3,400–3,450).
Failure to break above resistance leads to sharp rejection.
Price retraces to first support zone (aligned with EMA 200).
If support fails, deeper drop expected toward the lower support zone (~3,100).
Strategic Notes
📉 Bearish Bias if price fails to break above resistance.
🔍 Watch for bearish candlestick patterns or divergences near resistance.
🛡️ First support aligns with EMA 200, making it a critical level for bulls to defend.
🔻 Breakdown below 3,230 opens room for larger correction to 3,100–3,090.
Conclusion
Currently, the chart suggests a potential short opportunity if price confirms rejection at resistance. The EMA cross structure remains bullish long-term, but momentum is weakening, and failure to reclaim highs could shift sentiment bearish in the short to mid-term.


THE KOG REPORT - UpdateEnd of day update from us here at KOG:
Although our plan to short from the initial level didn't work as the level was broken through, the 2nd level gave us a scalp for a decent capture. Today we shared the long trade with the wider community, again giving a nice return, and that was enough on gold for the day.
We're a little stretched now and going long can be a bit risky with this 3390-95 region accumulating and starting to draw the mean upside. For that reason we've highlighted the potential range with support below at the 3360-5 level and resistance 3420 and above that 3431. These higher levels if attacked before a retracement we feel may give the opportunity to take the short, otherwise, support below holds, we're active above.
A break below 3385 is needed to go lower!
Red boxes:
Break above 3235 for 3243✅, 3245✅, 3247✅, 3252✅ and 3270✅ in extension of the move
Break below 3220 for 3210, 3206, 3196, 3188 and 3179 in extension of the move
As always, trade safe.
KOG

Gold 15min Breakout After Falling Wedge | Potential Upside Setu
Gold 15min Breakout After Falling Wedge | Potential Upside Setup
---
Description:
After forming a clear falling wedge pattern, Gold (XAU/USD) on the 15-minute chart has broken out to the upside. The breakout is supported by increasing volume and a strong bullish push. Entry was taken just after the breakout confirmation, with targets near the 3367 and 3420 zones. Risk is managed below the recent low at 3292.
This setup is purely based on technical analysis for educational purposes only. Always manage risk and follow your trading plan.

XAUUSD Day tradeThis is the breakout day range for xauusd/gold dmna average used for day trades with the breakout method and the momentum can decide to sell and buy

XAUUSD H4 Outlook – Monday, May 12, 2025Short-Term Bias: Bullish retracement toward premium zones
Structure: CHoCH confirmed at 3284 → forming potential bullish leg inside retracement
🔍 Recent Price Action (H4 Insight):
Clear CHoCH on H4 above 3292 → short-term structure flipped bullish.
Last impulsive leg pushed price into the 3330–3345 zone before rejecting slightly — signs of near-term resistance.
EMA5 and EMA21 are crossing upward, with price trying to retest EMA21 for a bounce.
Next H4 candle closure is critical — either holds 3290 for continuation or re-tests deeper zone.
📌 Key H4 Zones
Zone / Level Description
3380–3395 🔺 H4 FVG + OB zone – major near-term premium resistance (also Daily level)
3340–3345 🔁 H4 internal resistance – Friday top, low-volume gap area
3314–3318 🔁 Micro H4 imbalance – intraday fill zone
3284–3292 ✅ H4 CHoCH + OB – current bullish base, critical to hold
3250–3265 🔵 Deep demand – final intraday bounce zone before HTF demand
These levels will be your H4 battle zones — where price is likely to bounce, reverse, or accelerate depending on confirmation.
🔁 Potential Flow on Monday:
Bullish scenario:
If price holds 3284–3292 → intraday targets = 3318 → 3340 → 3380.
Clean structure = higher low + EMA support confluence.
Bearish scenario:
If price loses 3284 → could test 3250–3265. Only below this would invalidate current H4 bullish flow.
⚠️ Confluence Check:
EMAs: EMA5 crossing up through EMA21 → short-term bullish momentum building
Liquidity: Buy-side above 3345 → price may attempt sweep if supported
FVGs: Still unfilled gaps between 3314 and 3380 → magnet zones for bullish flow
CHoCH: Valid on 3284 → first HL attempt happening now
🧠 H4 Summary (for May 12):
Type Zone Reaction Potential
Resistance 3380–3395 Strong rejection possible
3340–3345 May slow price if volume weak
Support 3284–3292 Critical bullish structure zone
3250–3265 Breaker block zone (last bounce before HTF demand)
💬 Final Word to the Community:
Gold may have paused its moon mission at 3500, but the engines are refueling. Monday’s battle will be all about 3284 — hold it, and bulls might just take flight toward 3380. Lose it, and we buckle in for a deeper dip.
🟡 Whether you’re team buy-the-dip or wait-for-the-fade… stay sharp, stay patient, and always follow structure.
Like what you see? Drop a comment, tag a gold friend, and follow GoldFxMinds to never miss the real flow. 🧠⚡
