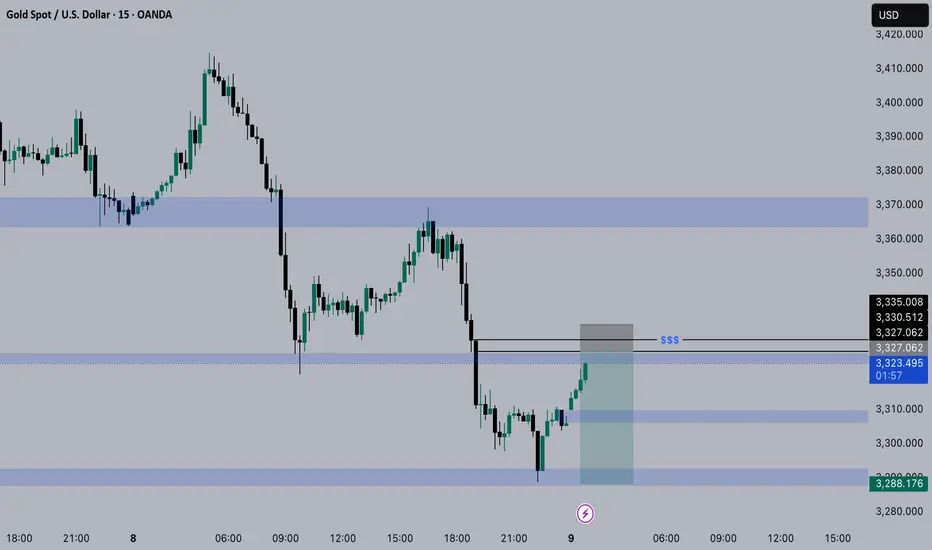
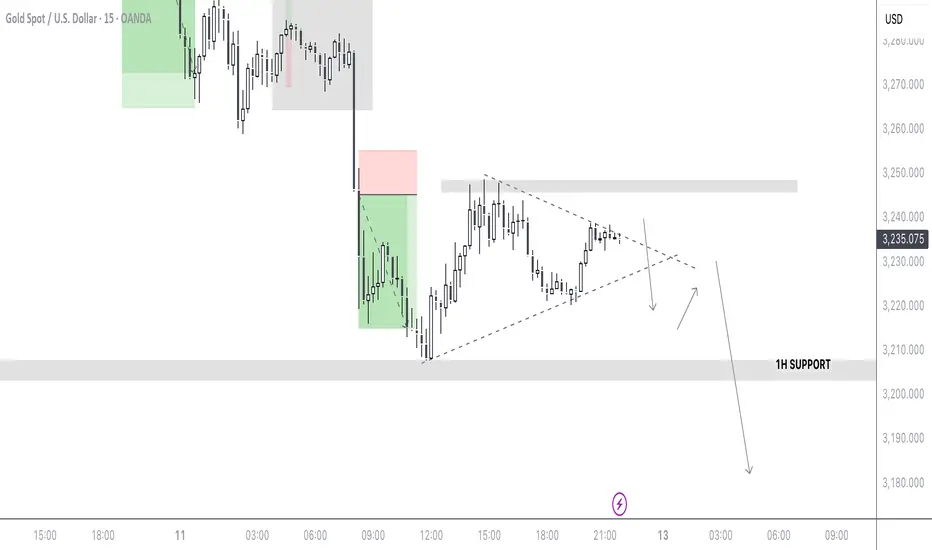
GOLD TRADE IDEA – XAUUSD 15-Min Chart | Sell SetupGold Spot (XAUUSD) is presenting a short (sell) opportunity on the 15-minute chart. The suggested sell zone is between 3235–3238, with multiple take-profit targets and a clear stop-loss:
Sell Entry: 3235 / 3238
TP 1: 3232
TP 2: 3228
TP 3: 3225
TP 4: 3222
TP 5: 3215
Stop-Loss (SL): 3245
This setup is based on price rejection from resistance and potential downward continuation toward the highlighted support zone. Always manage risk accordingly.
XAUUSD trade ideas

Gold trapped in box Look like it’s playing inside the box so buy from low of box sell from top and when it’s break it will move forward that direction.

XAUUSD IS RECOMMENDED TO BE SOLDHere I Created This XAUUSD Chart Analysis
Pair : XAUUSD (Gold)
Timeframe: 15 - Minutes
Pattern: Resistance Level
Momentum: Bearish/ SELL
Entry Level : SELL 3247
Resistance zone : 3254
Target Will Be : 3220
Disclaimer : This signal is based on personal analysis for learning purposes. Trade at your own risk and always use proper risk management.

Continuation sell off or Potential reversal? BUY/SELL MUST WETechnical Context (1H Chart Analysis):
Market structure is currently bearish on the 1H, with lower highs and lower lows.
Price is forming a potential short-term bottom near $3,220–$3,225, with some sideways consolidation, possibly a base for a bounce.
A key level to watch is the previous breakdown level around $3,260, which could act as resistance.
Trade Idea: Short-Term Buy (Intraday Bounce)
📥 Entry (Buy Market/Limit):
$3,225 (current consolidation zone)
🛑 Stop Loss:
$3,208 (below the recent low and liquidity sweep zone)
🎯 Take Profit Targets:
TP1: $3,248 (minor intraday resistance)
TP2: $3,260 (previous structure support turned resistance)
📊 Risk:Reward:
Risk: 17 points
Reward: 23–35 points
R:R Ratio: ~1.35 to 2.0
📉 Alternate Trade (If Price Rejects and Breaks Lower)
If we see a strong bearish candle close below $3,208, consider:
🔻 Sell Entry: $3,205
SL: $3,230
TP: $3,160 (clean support zone + high-volume node)
📏 Position Sizing Example:
For a $10,000 account risking 1% ($100), with 1 point = $1 per 0.01 lot:
Stop: 17 points → $100 / 17 = ~$5.88 per point → ~0.06 lots

Continue to short gold after the reboundFundamentals:
The positive signals from the China-US negotiations have eased the market's concerns about the US economic recession, and the weakening of risk aversion has stimulated a sharp pullback in gold. Market funds are no longer eager to seek safe-haven assets, so they withdraw their funds from gold and turn to risk markets.
Technical aspects:
The gold price plummeted by $110 during the day. Although it has rebounded slightly at present, the overall rebound momentum is relatively weak. The upper 3280-3290 area is currently the main short-term suppression level, followed by the 3240-3250 area. If the rebound in this area is not broken, you can continue to short gold, and the shorts may continue to reach new lows; focus on the support of the 3200 mark below. If 3200 is not broken, then the bulls may try to counterattack and fill the upper gap; if gold falls below 3200, gold will continue to fall to the area around 3170.
Trading strategy:
1. Consider shorting gold after it rebounds to the 3245-3255 area, TP: 3220
2. Consider going long on gold after it continues to fall to the 3180-3170 area, TP: 3220;
3. If gold stabilizes above 3200, we can consider going long on gold around 3200 in advance.
Gold H4: Sell Below Resistance Toward \$3,200XAUUSD (Gold vs USD) and outlines a range-bound trading scenario with key levels and potential price targets. Here’s a breakdown of the analysis:
🔍 Key Observations:
Support Zone (~$3,200 - $3,230):
Highlighted with yellow shading and green arrows.
Multiple historical bounces show this as a strong demand area.
Aligns closely with the 200 EMA ($3,223), reinforcing its strength.
Resistance Zone (~$3,350 - $3,375):
Marked as “RESISTANCE + TARGET 1”.
Previously acted as a ceiling; several price rejections noted.
A breakout above this zone could aim for Target 2: $3,400+.
Current Price (~$3,277):
Price is between the 50 EMA ($3,322) and the 200 EMA ($3,223).
Possible consolidation or preparation for a breakout.
Targets:
Target 1 (Downside): ~$3,200 — possible if price rejects from current level and breaks below support.
Target 2 (Upside): ~$3,400 — achievable if resistance breaks.
Price Projection Paths:
Bearish path: Rejection → retrace to support → break → Target 1.
Bullish path: Pullback → support holds → breakout → Target 2.
⚖️ Trading Idea Summary:
Bullish Bias above $3,230: Watch for a bounce and break of resistance toward $3,400.
Bearish Bias below $3,223: Watch for a breakdown and fall toward $3,200.
Use candlestick confirmation and volume for entry validation.

Gold's callback remains bearish
As expected, the market weakened and fell again. Today, the lowest price fell to 3215. There are countless opportunities to stop profit and leave the market. Even if you don't operate, you can see the strategy time I publish every day. This can be regarded as the first round of gains since the opening. Although there is no long position, the short position is still good!
Approaching the European session, I also mentioned at noon that the rebound upward can continue to bet on the second short position. Both the time and the point are given. The highest rebound in the European session is 3266. The point I gave is 3260-63. There should be countless opportunities to enter the market. The current gold price fell to 3237! Still the same point of view, it is easy to make a profit of at least 20-30 points each time! If you have been facing losses, it means that you have not focused on the free strategies I publish every day.
Traders who did not enter the market today are advised to continue to pay attention to the 3266 resistance and enter the market again. The support below is 3215. Before the data market is released, it will be treated as a volatile trend. I will make real-time suggestions when the breakout occurs.
Hello traders, if you have better ideas and suggestions, please leave a message below, I will be very happy

GOLD: Local Bearish Bias! Short!
My dear friends,
Today we will analyse GOLD together☺️
The market is at an inflection zone and price has now reached an area around 3,237.87 where previous reversals or breakouts have occurred.And a price reaction that we are seeing on multiple timeframes here could signal the next move down so we can enter on confirmation, and target the next key level of 3,220.77.Stop-loss is recommended beyond the inflection zone.
❤️Sending you lots of Love and Hugs❤️

short buyfibo buy to tp1 first according to fibo buy. at the same time, we still need monitor once hit tp1, either price up to tp2 or pullback to entry zone

Gold Technicals & Potential Fundamental OutlooksPrice action shows gold respecting a key horizontal support zone around $3,215–$3,225, where multiple previous rejections have occurred. The latest candlesticks reveal long wicks to the downside and rejection from that area, indicating strong buyer interest and potential accumulation. Volume is increasing, which reinforces the credibility of this support.
The structure points to a potential reversal setup as the market creates a base and shows early signs of higher lows. If price breaks and closes above the minor resistance around $3,245–$3,255, bullish momentum may follow, targeting the next swing highs near $3,300–$3,340.
A clean invalidation for this bullish bias would be a breakdown below the $3,215 support zone with strong volume.
Key Technical Levels:
Support: $3,215–$3,225 (major support zone)
Resistance: $3,255 (minor), then $3,300–$3,340
Bias: Bullish above $3,255, cautious below $3,215
Some USD-impacting events for today include:
U.S. CPI or PPI data – Inflation readings can influence Fed rate expectations, affecting gold.
Fed speeches – Any hawkish/dovish signals from Federal Reserve officials will shift sentiment.
Retail Sales or Consumer Sentiment (UoM) – Strong numbers might boost the dollar and pressure gold, while weak ones can do the opposite.

XAU usd trade planExpecting this in couple of days or weeks that a gold can further go down by following the bat harmonic pattern.
If it follows the same, then a 3-4 % drawdown is expected. Or else we can expect a sideways movement.

gold on bearish#XAUUSD on price correction, possible breakout at 3350 will take reverse on sell which can drop till 3300.
Now we await for this zone to sell, 3350,3362,3331 and 3323, but main price is at 3350 which holds strong decline on sell, Target 3300, stop loss 3371.
Above 3371 holds bullish which will take the price back 3400.

Gold fluctuates. When will a new trend start?China and the United States reached a 90-day ceasefire agreement, and the price of gold returned to 3,200 from 3,400 US dollars. All traders are staring at the support level of 3,200 US dollars, and are very worried about whether it can withstand pressure; it will fall to a larger level, resulting in no trading opportunities for gold positions.
I think your concerns are normal, and market fluctuations are also normal. There is no market that only rises and never falls; even in the bull market, there will be periodic adjustments.
Next, the focus is on the maturity of US Treasury bonds in June. The impact of trade conflicts will soon be forgotten by the market; US CPI inflation continued to decline in April, from 2.4% in the early stage to 2.3%, getting closer and closer to the Fed's ultimate goal of 2%, which means that the Fed will soon have to restart the interest rate cut plan.
Once the US Treasury bonds mature and default or trigger panic, or if Fed Chairman Powell reveals his intention to cut interest rates, gold will rise rapidly and may reach a high point within 1-2 days.
Okay, everyone; you need to understand the basic situation, but the most important thing is the operation strategy during the Asian trading session.
I think you can first test the long strategy around $3225, with a stop loss below 3215 and a profit in the rebound range of $3340-3360.
Man, excessive worrying will not help; if you can't accept short-term volatility trading, you can wait and see and stay calm.

Potential bullish reversal XAUUSDThe market rejected a 4H demand zone identified by an Order Block (OBT), with a clear “Sellers Failed” signal—indicating a failed bearish continuation attempt. This suggests a potential bullish reversal.
📈 Anticipated Move:
The price is likely to target the following key resistance zones:
Daily Entry Sell Resistance: 3,265.74
50% Entry Sell Resistance: 3,317.03
4H Entry Sell Resistance: 3,360.73
📌 Technical Confluence:
Presence of Equal Highs (potential liquidity pool)
Consolidation structure forming above OBT
Price action building for a possible bullish leg
📊 Bias:
Short to mid-term bullish, with close monitoring of marked resistance zones for take-profit or invalidation scenarios.

XAUUSD GOLD LONG/BUYBy utilizing Fibonacci retracement levels, historical patterns, , we can formulate a hypothesis that the market might follow a similar trajectory if bullish sentiment prevails.

Selling Gold Triangle Pattern / XAUUSDI see price moving much lower due to to continued easing in the US/China Trade war.
Here on the 15m, a triangle is forming and we are waiting for further confirmation for price to drop lower.
- Plan to sell at market open with high risk setup
- Wait for additional confirmation
GOLD (XAUUSD): Trading Plan BEFORE FOMC
Gold bounced yesterday, as I predicted.
Today, we see a retest of a broken daily resistance
that turned into support after a breakout.
BEFORE FED Rate Decision today, there is another opportunity
to buy Gold:
I see a double bottom pattern on an hourly time frame.
Bullish violation of its neckline and an hourly candle close above
3394 will provide a strong intraday confirmation.
It will push the prices at least to 3429 level.
❤️Please, support my work with like, thank you!❤️
I am part of Trade Nation's Influencer program and receive a monthly fee for using their TradingView charts in my analysis.

Gold on a declineTechnical analysis: Even though the Price-action invalidated the Lower High’s (Hourly 4 chart’s) Ascending Triangle trendline, it failed to test the #3,200.80 benchmark / acting as an first Medium-term Support zone, so Technically Gold is is still near Lower High’s Lower zone extension, and if Price-action closes the session above #3,200.80 benchmark, Gold will be Targeting #3,300.80 benchmark / fractal on yet another Buying sequence. If however #3,200.80 - #3,192.80 first Short and Medium-term Support gets invalidated, then the Hourly 1 chart’s variance of #3,152.80 benchmar should be tested, in case of Bearish sequence below, Price-action will be calling for #3,100.80 final line of the defence and as discussed, possible Stabilization zone ahead of possible relief rally. Subsequently, previous Hourly 4 chart’s Support of #3,252.80 benchmark was firmly broken and current configuration pointed out to a new bigger proportion downtrend, where Fundamentals are confirming the as well the speculative downtrend in continuation.
My position: Gold found the Support almost delivering Double Bottom formation and market closing is on main stage. Either closing above #3,200.80 benchmark and #3,300.80 re-test or DX delivering Buying sequence in extension / in that case Gold eyes decline in continuation.

A failure to hold $3000...NO...
Gold has NOT properly tested $3000 yet. Does it HAVE to be tested? Of course not.
I have outlined TWO bullish scenarios.
A failure to hold $3000 (or the 12 month sma) opens up a more nefarious type of correction. See 2008 where the 36 month sma got retested.

XAUUSD Bullish or bearish Detailed AnalysisXAUUSD is currently trading around 3380, continuing its bullish momentum as previously anticipated. The price action has followed the projected path, delivering substantial profits for those positioned early. The next key resistance level is at 3450, aligning with the upper boundary of the ascending channel.
Fundamentally, gold's rally is supported by heightened safe-haven demand amid ongoing geopolitical tensions and a weakening U.S. dollar. Investors are closely watching the upcoming Federal Reserve meeting, with expectations leaning toward a dovish stance, which could further bolster gold prices .
Technical indicators suggest that the bullish trend remains intact, with the price maintaining its position above key moving averages. However, traders should be cautious of potential pullbacks as the market approaches overbought conditions.
In summary, XAUUSD is on track toward the 3450 target, supported by both technical and fundamental factors. Traders should monitor key resistance levels and macroeconomic developments to manage their positions effectively.

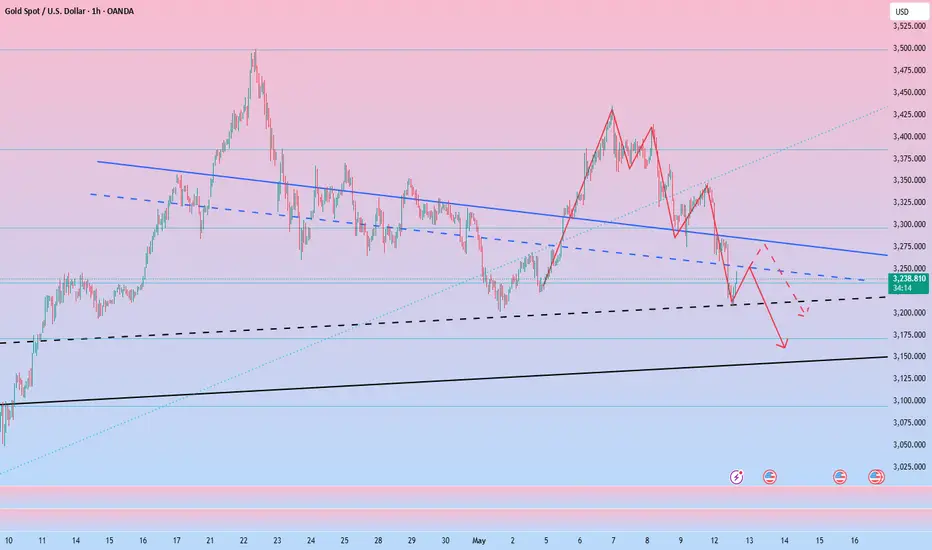
Gold Trade plan 13/05/2025Dear Traders,
It seems that the price is approaching the middle of its descending channel. The 3270–3300 zone is an important area for gold. In case of a fake breakout or rejection, the price could drop to the 3140–3150 zone. I’m waiting for a confirmation candle to enter a position in that area.
If you enjoyed this forecast, please show your support with a like and comment. Your feedback is what drives me to keep creating valuable content."
Regards,
Alireza

Gold making triangle shape in 4H chart- BearishGold is making triangle shape in 4H chart that will possibly be bearish sign.
