Gold operation strategyFrom the 4-hour analysis, the support below is around 3300-08. If it does not break, continue to be bullish. Pay attention to the short-term suppression of 3360-66 above. If the daily level stabilizes above this position, continue to maintain the low-multiple rhythm.
Gold operation strategy:
1. Go long when gold falls back to 3320-25, and cover long positions when it falls back to 3300-10, stop loss 3297, target 3355-3360, and continue to hold if it breaks;
XAUUSD trade ideas

XAU/USD Analysis: Chart Indicates Elevated VolatilityXAU/USD Analysis: Chart Indicates Elevated Volatility
The XAU/USD chart shows that the ATR (Average True Range) indicator has reached its highest level in several weeks, signalling increased market volatility.
In addition, trading activity is being fuelled by heightened geopolitical tensions, now including an escalation of the conflict between India and Pakistan.
The price action analysis of the precious metal also provides valuable insight, highlighting the ongoing battle between supply and demand.
Technical Analysis of the XAU/USD Chart
On 23 April, we noted a sharp shift in sentiment after the price of XAU/USD peaked around $3,500.
Gold price fluctuations today suggest continued bearish pressure above $3,400, leading to a downward reversal at peak B, which sits below the previous high at A.
This forms the basis for outlining a descending channel and suggests that bears may attempt to keep the price within its boundaries. On the other hand, the $3,333 level was decisively broken by a wave of buying (shown with a blue arrow), and a bullish “cup and handle” pattern is emerging in the background — it is possible that, as part of the May rally, bulls may try to surpass peak B.
Whatever the outcome, elevated volatility appears likely to persist — especially with the US Federal Reserve’s interest rate decision due today at 21:00 GMT+3, followed by Jerome Powell’s press conference at 21:30.
This article represents the opinion of the Companies operating under the FXOpen brand only. It is not to be construed as an offer, solicitation, or recommendation with respect to products and services provided by the Companies operating under the FXOpen brand, nor is it to be considered financial advice.

It’s the right time to go shortLast week, gold came under pressure at the key resistance of 3356 and then fluctuated downwards. The market jumped short and opened low, directly breaking through the support to a low of 3259, and the daily line continued the downward trend. The current market is in the daily level adjustment stage, but the downward momentum is strong and the risk of breaking continues to accumulate. From a technical perspective, 3280 constitutes a short-term upward resistance. If the rebound is blocked, you can still choose to arrange short orders; there is strong support near 3240 below, and it is necessary to pay attention to whether this position can be effectively broken to confirm the accelerated decline. On the news side, the easing of the Sino-US tariff situation has weakened the market's risk aversion sentiment. In addition, the bullish momentum of gold has been exhausted after the previous consecutive rises, and the recent weak and volatile pattern has become prominent.
Gold recommendation: short near 3280-3290, target 3270-3260.

Flying Bats & Soaring Gold PriceGold takes flight! 🦇✨
Bouncing off the 0.88 Fib level, it's shining bright amidst the stock market's turbulence.
Stay golden, friends!

The bull market ends and gold continues to fallGold is currently trading around $3310, facing strong resistance near the )$3320–$3330) zone after a sharp upward move. I am supporting a SELL bias, anticipating a potential rejection from resistance and a move to the downside.
📈Key Resistance:$3330 A key level where I expect sellers to step in.
📈Major Resistance Zone: $3330–$3340 – If broken, further upside is possible, but this zone remains a strong barrier for now.
📉Bearish Targets:
📉Target 1: $3290 Initial support and short-term profit zone.
📉Target 2: $3264 Deeper pullback level.
📉Target 3: $3242 Final target before reaching major demand.
📉Support Area: $3220 $3210
A high-probability demand zone where buyers may defend the level and sellers could take profit.
📊Outlook: I remain bearish as long as price holds below $3330. A clear rejection from this area would strengthen the bearish case. A break above $3340 would invalidate the setup and shift focus to the bullish side.
I know that many people are losing their accounts or opinions due to the sudden rise and fall of their accounts. If you are a novice or you need some free professional advice, please contact me. I hope to help you.

Valid or fake out? - [1H] formationHere is what I noticed—let me know if this aligns with your perspective or if you see something different.
📌 Wave Structure Alignment
Wave A → C → E show corrective declines within the contracting triangle.
Wave B → D retrace in a controlled manner, respecting contraction limits.
Price tightening near 3392 - 3360, signaling absorption before a breakout move.
📌 Fibonacci Relationship Check
Wave A retraced ~38.2% - 61.8% of the previous impulse move.
Wave B & C followed standard corrective depths (~50% - 78.6%), aligning with expected fib levels.
Wave E represents the final squeeze (~38.2% - 61.8% of Wave D), acting as a breakout trigger.
📌 Liquidity Positioning & Institutional Play
Bullish Breakout Potential: A strong push above 3417 could activate momentum toward 3440 - 3510, but only if absorption transitions into expansion.
Bearish Breakdown Risk: If price rejects 3392, expect a liquidity grab driving price into 3303 - 3370 range.
💡 Verdict: What to Watch Next
The triangle structure appears valid, following typical Fibonacci relationships and smart money positioning. However, the breakout direction remains uncertain—monitor liquidity behavior closely before confirming entry.
📌 Key Levels in Play
🔹 3378 Retest: A crucial resistance zone—failure to reclaim suggests strong sell pressure.
🔹 Break Above: If buyers absorb selling pressure, the move could extend past 3385 pivot, favoring bulls.
🔹 Failure to Hold: A rejection at 3378 could induce fast liquidation, sending price toward 3363 and below.
🔥 Smart Money Perspective
Institutions may test 3378 multiple times before deciding the next move.
If absorption strengthens , price may lean bullish.
If rejection dominates , expect a fast downward sweep into 3339 - 3326 range.
The liquidity game is in play—what’s your take on this setup? Anything you’d fine-tune based on current order flow? 🚀🔥 Would love to hear your perspective!

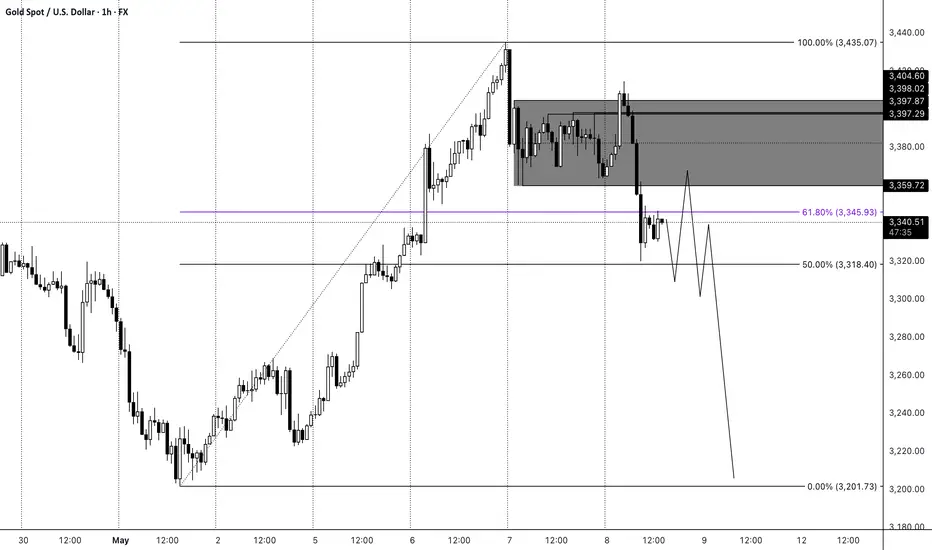
Gold Narrative OverviewGold remains in a long-term and medium-term uptrend, while currently showing signs of a short-term pullback. Given this context, the most logical stance is to continue looking for buying opportunities. However, price has reached rather extreme levels after a sharp and uninterrupted rally in recent weeks. That’s why I lean toward the expectation of at least a temporary pause followed by a downside correction and the formation of a consolidation phase.
On the local timeframe, I anticipate that the price may continue to move lower through a consolidation, targeting the previous support level around 3,201. While short-term bullish impulses are still possible, I expect the broader move to be downward. This bearish setup would be invalidated if the price breaks above 3,380.
Falling towards pullback support?The Gold (XAU/USD) is falling towards the pivot and could bounce to he 1st resistance which has been identified as a pullback resistance.
Pivot: 3,361.29
1st Support: 3,310.00
1st Resistance: 3,490.34
Risk Warning:
Trading Forex and CFDs carries a high level of risk to your capital and you should only trade with money you can afford to lose. Trading Forex and CFDs may not be suitable for all investors, so please ensure that you fully understand the risks involved and seek independent advice if necessary.
Disclaimer:
The above opinions given constitute general market commentary, and do not constitute the opinion or advice of IC Markets or any form of personal or investment advice.
Any opinions, news, research, analyses, prices, other information, or links to third-party sites contained on this website are provided on an "as-is" basis, are intended only to be informative, is not an advice nor a recommendation, nor research, or a record of our trading prices, or an offer of, or solicitation for a transaction in any financial instrument and thus should not be treated as such. The information provided does not involve any specific investment objectives, financial situation and needs of any specific person who may receive it. Please be aware, that past performance is not a reliable indicator of future performance and/or results. Past Performance or Forward-looking scenarios based upon the reasonable beliefs of the third-party provider are not a guarantee of future performance. Actual results may differ materially from those anticipated in forward-looking or past performance statements. IC Markets makes no representation or warranty and assumes no liability as to the accuracy or completeness of the information provided, nor any loss arising from any investment based on a recommendation, forecast or any information supplied by any third-party.

DeGRAM | GOLD held the support line📊 Technical Analysis
● OANDA:XAUUSD tagged the purple support line at $3 300 inside the green demand zone, then printed a bullish engulfing candle.
● Price is climbing within the rising‑channel mid‑band; reclaiming the black support level $3 360 should propel gold to the upper resistance level near $3 500. Long view void on a close below $3 200.
💡 Fundamental Analysis
● Fed Vice‑Chair Jefferson signalled rates are “sufficiently restrictive” amid cooling CPI base effects, pressuring real yields and the USD.
✨ Summary
Channel‑base rebound plus strong Asian demand and a dovish Fed backdrop support a short‑term long: targets $3 360 → $3 500; invalidate under $3 200.
-------------------
Share your opinion in the comments and support the idea with a like. Thanks for your support!

Gold Trade Plan 06/05/2025Dear Traders,
price broken 3320 (Means Market will continue Upward movement)
i expect price will be continue upward movement to 3400-3420 Area Today ,
If you enjoyed this forecast, please show your support with a like and comment. Your feedback is what drives me to keep creating valuable content."
Regards,
Alireza

XAUUSD Analysis todayHello traders, this is a complete multiple timeframe analysis of this pair. We see could find significant trading opportunities as per analysis upon price action confirmation we may take this trade. Smash the like button if you find value in this analysis and drop a comment if you have any questions or let me know which pair to cover in my next analysis.

Gold on a declineTechnical analysis: Even though the Price-action invalidated the Lower High’s (Hourly 4 chart’s) Ascending Triangle trendline, it failed to test the #3,200.80 benchmark / acting as an first Medium-term Support zone, so Technically Gold is is still near Lower High’s Lower zone extension, and if Price-action closes the session above #3,200.80 benchmark, Gold will be Targeting #3,300.80 benchmark / fractal on yet another Buying sequence. If however #3,200.80 - #3,192.80 first Short and Medium-term Support gets invalidated, then the Hourly 1 chart’s variance of #3,152.80 benchmar should be tested, in case of Bearish sequence below, Price-action will be calling for #3,100.80 final line of the defence and as discussed, possible Stabilization zone ahead of possible relief rally. Subsequently, previous Hourly 4 chart’s Support of #3,252.80 benchmark was firmly broken and current configuration pointed out to a new bigger proportion downtrend, where Fundamentals are confirming the as well the speculative downtrend in continuation.
My position: Gold found the Support almost delivering Double Bottom formation and market closing is on main stage. Either closing above #3,200.80 benchmark and #3,300.80 re-test or DX delivering Buying sequence in extension / in that case Gold eyes decline in continuation.

gold still is in bullish side!!!we should just buy gold in deeps guys...every steps down in gold is an goooooood chance to buy it and hold it for saving money an make profit...just buy buy buy gold in deeps and corrections

GoldXAUUSD
- Symmetrical Triangle as an corrective pattern in Short Time Frame
- Break of Structure
- S / R Level
- Completed " 123 - abc " Impulsive Waves
- Fibonacci Level - 50.00% / 61.80%

GOLD SELL SETUP
To determine the reason behind selling gold at $3263:$3264, let's examine current market conditions and possible factors influencing this decision.
*Possible Reasons:*
- *Resistance Level*: $3263:$3264 might be acting as a resistance level, where gold prices face selling pressure or struggle to break through. This level could be influenced by historical price movements or technical indicators.
- *Profit-Taking*: Investors might be selling gold at this price range to secure profits, especially after recent gains. This decision could be driven by market volatility or shifts in sentiment.
- *Market Sentiment*: Changes in market sentiment, driven by news or economic data, can impact gold prices. If sentiment is bearish, traders might be more inclined to sell at $3263:$3264.

XAUUSD SIGNAL READ THE CAPTAINXauusd signal technical analysis satup 👇🏼
( Xauusd ) Sell zone
( TRADE SATUP)
ENTRY POINT (3366) to (3368) ✅
FIRST TP (3360)✅
2ND TARGET (3354) ✅
LAST TARGET (3345) ✅
STOP LOOS (3374)❌
FALLOW RISK MANAGEMENT ✅✅

XAU/USD: NFP has come,What's Next? (READ THE CAPTION)By analyzing the gold chart on the 1-hour timeframe, we can see that after yesterday’s analysis, the price successfully rallied from $3231 to $3268. Once it reached that zone, selling pressure kicked in, and gold has since corrected down to $3239.
If gold stabilizes below $3257, we may expect further downside. The potential bearish targets are $3237 and $3221.
Keep a close eye on the $3209–$3220 zone, as price reaction there could be significant.
Please support me with your likes and comments to motivate me to share more analysis with you and share your opinion about the possible trend of this chart with me !
Best Regards , Arman Shaban

Gold Potential Reversal | XAU/USD Intraday SetupChart Analysis (Gold - XAU/USD, 15-Minute Timeframe):
Trend: After a strong bearish move, price has reacted from a key support zone.
Volume: High volume during the drop may indicate a stop hunt or panic sell.
Structure: A potential double bottom or bullish reversal pattern is forming.
Setup Idea: Price bounced near the 3,275 zone. The chart suggests a bullish structure with higher highs and higher lows expected.
Entry Zone: Around 3,275.
Stop Loss: Below 3,258.
Take Profit: Targeting the 3,335–3,340 area.
---
Description:
Gold shows signs of a potential bullish reversal after a sharp drop and bounce from support. Volume spike and price structure hint at recovery. Targeting the 3,335+ zone with SL below 3,258. This chart is for educational purposes only—always use proper risk management.

3419 , gold price can reach today⭐️GOLDEN INFORMATION:
Gold price (XAU/USD) pulls back slightly from its intraday peak near a two-week high reached during Tuesday’s Asian session, but remains firm around the $3,360 mark, extending its winning streak for a second day. Improved US economic data has helped temper recession fears, offering modest support to the US Dollar. Meanwhile, signs of a potential thaw in US-China trade tensions have curbed safe-haven demand for gold, prompting some investors to adopt a wait-and-see approach ahead of the highly anticipated two-day FOMC policy meeting.
⭐️Personal comments NOVA:
Bulls regain the upper hand, uptrend nears 3400 ahead of market interest rate cut expectations
⭐️SET UP GOLD PRICE:
🔥SELL GOLD zone : 3418- 3420 SL 3425
TP1: $3410
TP2: $3400
TP3: $3385
🔥BUY GOLD zone: $3323 - $3321 SL $3316
TP1: $3330
TP2: $3340
TP3: $3358
⭐️Technical analysis:
Based on technical indicators EMA 34, EMA89 and support resistance areas to set up a reasonable BUY order.
⭐️NOTE:
Note: Nova wishes traders to manage their capital well
- take the number of lots that match your capital
- Takeprofit equal to 4-6% of capital account
- Stoplose equal to 2-3% of capital account

Gold another shortShort from 3350$ .
i think gold will keep going down .
It is time for crypto to take the momentum

Gold price analysis May 6Due to the impact of world economic and political tensions. The gold candle has reversed to increase again with the D1 candle increasing by nearly 100 prices.
The gold uptrend has formed and it is easier to trade to find entry zones. Today's beautiful Buy zone is noticed in the price retests to the Break out zone. 3328 is considered a buying opportunity today. Currently, gold is sideways in the 3372 and 3354 range. Watch for a breakout to trade the breakout and wait for the main entry zone. When gold increases, it will encounter barriers or targets for buy orders at 3410. Today is a day without much important news, so the 3410 and 3328 ranges are considered strong. If it breaks through this range, pay attention to the quite far range around 3445 and 3270

Gold head and shoulders bottom trend, bull market strong?🗞News side:
1. Tariffs push up inflation and slow down the economy, and the Federal Reserve may be in trouble
2. The situation between India and Pakistan escalates again
📈Technical aspects:
At the hourly level, today's Asian session continued the "wash-out" operation characteristics, quickly rising by 20 US dollars at the opening, and then stepped back to 3310 to confirm the top and bottom conversion support level. The two positive lines seemed to form a "yang-enclosing-yin" upward attack pattern, but suddenly reversed, not only breaking the trend support line of 3280, but also falling to 3274 before bottoming out and rebounding. This erratic trend has a significant long-short double kill effect for investors accustomed to trend continuation strategies. However, we can accurately find the right position in the market to trade and make profits.
At present, it is expected to form a "head and shoulders bottom" pattern from a morphological perspective, accumulating momentum for subsequent rises, and there is still room for upside in the short term. At present, any pullback is an opportunity for us to go long. Pay attention to the 3360-3370 line suppression on the top. If this resistance area is broken, it may open up a new round of upward space.
TVC:GOLD FOREXCOM:XAUUSD FXOPEN:XAUUSD TVC:GOLD FX:XAUUSD OANDA:XAUUSD

Gold is expected to pull back, short gold!Fundamentals:
Focus on the Fed's interest rate decision and Powell's speech;
I think the Fed will keep the interest rate decision unchanged this time, at least it will not announce a rate cut this time, which may suppress the gold market;
Technical aspects:
Before the Fed's interest rate decision, gold is currently in a volatile state. However, relatively speaking, it is currently in a volatile and bearish state, with short-term resistance in the 3395-3405 area; and gold has repeatedly tested the 3370-3360 below during the retracement process. After multiple tests, gold may be more likely to break through this support area; the key support below is in the 3360-3350 area, followed by the 3320-3310 area.
Trading strategy:
Consider shorting gold in the 3395-3405 area, TP: 3370-3360
