NVIDIA (NVDA) – Inverse Head & Shoulders Breakout in PlayNASDAQ:NVDA NVIDIA (NVDA) – Inverse Head & Shoulders Breakout in Play
NVDA has broken above a key neckline at $108, confirming a classic inverse head & shoulders pattern. With the head at $85, the breakout projects a target around $138.
Trade Plan:
Entry: $117 (current level)
Stop Loss: $107 (below neckline)
Target: $138
Risk–Reward: ~1:2.1
Strong volume on the breakout adds conviction. Watching for continuation toward the projected target in the coming weeks.
#NVDA #Breakout #InverseHeadAndShoulders #SwingTrade #TechnicalAnalysis
NVD trade ideas

Nvidia - The bullish consolidation flag!Nvidia - NASDAQ:NVDA - is still quite bullish:
(click chart above to see the in depth analysis👆🏻)
After Nvidia retested a major horizontal support just last month, we witnessed an extremely strong bullish reversal candle which resulted in a strong +50% rally. Considering the bullish flag consolidation, a breakout is much more likely, but not in the immediate future.
Levels to watch: $150
Keep your long term vision!
Philip (BasicTrading)

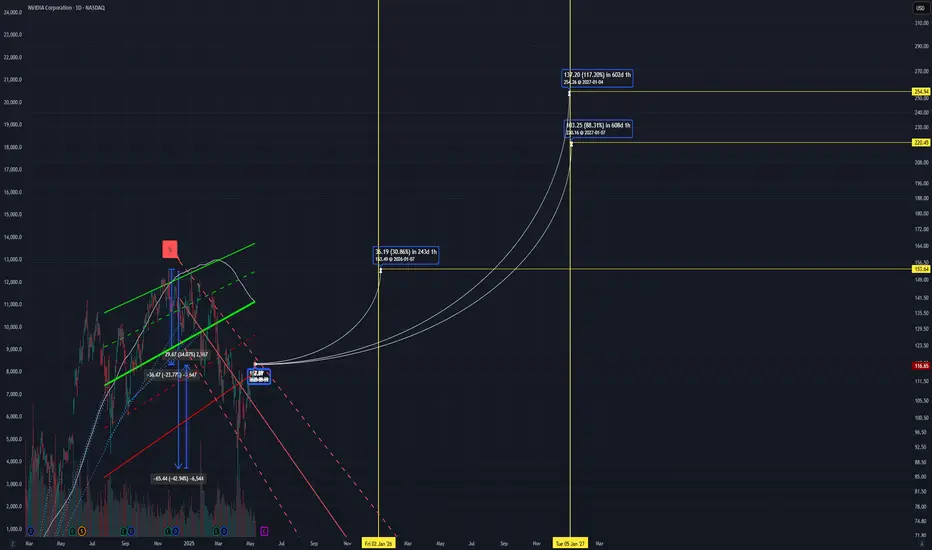
$NVDA: Full on Bull mode. 170 $ before end of Summer Happy Monday. A new week, new trade for you guys. How does the largest AI stock looks like today with US-China Tariff pause for 90 days behave? Today the stock NASDAQ:NVDA broke the 1.0 Upward sloping Fib retracement channel with which we have been working for months now. The stock opened @ 122 % which is the 1.0 Fib retracement level. If we extend the channel and extrapolate then we see the next levels and the resistance levels.
In our Fib Chart here the next level is 1.6 Level which is @ 137 $. In my opinion with RSI at 50 and NASDAQ:NVDA having some high level of short interest. 1.12 % of the float is short which is high going back to 2021 bear market. So, this helps have violent short covering rally in the short term. Bullish before we turn bearish. RSI may top out at 85 in this bull rally phase. This cycle bull r un can take it to 170$ before end of Summer 2025.
Verdict : NASDAQ:NVDA next levels : 135 $ ; cycle top @ 170 $.

NVIDIA Breaks Out - Is a Bigger Rally Coming?NVIDIA Breaks Out - Is a Bigger Rally Coming?
NVIDIA has broken out of a bullish triangle pattern, signaling that it might be ready to climb higher. In my view, the bottom was reached at 86.00, as even market pressures from Trump couldn't push it down further.
NVIDIA seems to be waiting for more details on the US-China trade deal before making a stronger upward move.
If positive developments emerge, it could trigger a bigger bullish wave, lifting the stock even higher.
You may find more details in the chart!
Thank you and Good Luck!
❤️PS: Please support with a like or comment if you find this analysis useful for your trading day❤️

NVDA New 2025 All-Time High Explained, 153 Next Followed by 194The NVDA stock just hit its highest price since March. Today it moved above resistance while producing a perfect ascending triangle pattern.
This is a major development because the resistance level that was broken today, 114, rejected growth a total of 4 times. NVDA moving above this level confirms the continuation of the bullish move coming from a technical analysis perspective.
Just to be unbiased, I have to mention that there is still one final level to conquer before the chart truly points to a new All-Time High.
The resistance is not a single price but a range, the resistance zone. This range sits between 114 and 123. Once NVDA closes decisively above 123, say a full daily or weekly candle with really high volume, we have a test of the All-Time High as resistance confirmed.
Depending on how the market reacts once the ATH is challenged we can determine what will happen next.
For example, if the ATH produces a very strong rejection with really high bearish volume, we know that a major correction will follow and even a lower low becomes possible. But, on the other hand, if challenging the ATH results in a mild market reaction, a normal drop/retrace then immediately we know that additional growth will happen after a higher low.
The truth is, Nvidia will move up, fight a little bit at the ATH and then continue growing. Just as we predicted the bottom we can predict what will happen next based on the chart. The chart is saying up long-term and this means a new All-Time High in 2025. Rest easy.
Thank you for reading.
Your support is appreciated.
Namaste.

NVDA eyes on $105: Support for one last DIP before new highs?Followup to my warning about $113.56 (click)
NVDA back to the Golden Genesis Fib, a major landmark.
If we are to see one more dip from here, look for $105.08
If we continue then lookout for the Golden Covid at $122.25
.
Big picture view showing the $113.56 Golden Genesis
=======================================================

NVIDIA (NVDA) 4H Outlook – May 2025Price has recently shown multiple Breaks of Structure (BoS) to the upside, suggesting a potential shift in market sentiment. After a liquidity sweep of the prior low, price began forming higher highs and higher lows.
Currently trading around $116.62, NVDA may revisit the demand zone between $107.99–$110 (highlighted in green) before resuming bullish momentum. If that level holds, we could see a continuation towards the $129.41 target zone, aligning with prior market structure and supply.
This setup aligns with smart money concepts—monitor for confirmation at the demand zone before entering long.

NVIDIA (NVDA) investors should knowHello NVIDIA (NVDA) investors,
Looking at the daily chart below, we see that NVDA briefly broke out of its long‑standing yellow descending channel only to be pulled back in; price is now testing horizontal support in the $100–150 range. In the lower pane, RSI remains negative and has yet to break its downtrend line around the 41 level.
Technical Analysis
Descending Channel:
The stock has been trading inside a long‑term descending channel. Selling pushed it back inside after a false breakout near $137–142. The upper channel line sits around $115—until we see a daily close above that, a true trend reversal is unlikely.
Horizontal Support/Resistance:
Support: $95-100 (confluence of past lows and the channel’s lower boundary)
Resistance: $147-150 (channel upper line), then $145–150 (early‑April highs)
RSI:
Currently ~41. A break above the RSI downtrend near 45–50 would signal improving momentum; if it fails, we could retest oversold territory.
Fundamental & Macro Factors
Quarterly Results:
NVDA reported strong revenue and margin growth last quarter, driven primarily by AI/data‑center demand.
AI & Data‑Center Demand:
Demand from AI‑focused servers and cloud providers remains very high, and this secular trend is expected to persist.
Trump’s Latest Tariffs:
In early March 2025, an additional %145 tariff on China‑origin semiconductors was announced. This measure may raise NVDA’s export costs to China and exert short‑term margin pressure. It also risks demand swings as Chinese buyers adjust their inventory strategies.
Strategic Recommendations
Stop‑Loss:
Consider a stop‑loss on daily closes below $90 to protect long positions.
Position Sizing:
Scale into longs near support, and take profits incrementally near resistance.
Tariff Watch:
Monitor any further U.S. export restrictions or tariff changes on China—each announcement can drive volatility
-Celil Adıgüzel

OptionsMastery: A potential trend change on NVDA? 🔉Sound on!🔉
📣Make sure to watch fullscreen!📣
Thank you as always for watching my videos. I hope that you learned something very educational! Please feel free to like, share, and comment on this post. Remember only risk what you are willing to lose. Trading is very risky but it can change your life!

NVDA Trade Setup Eyeing the Bounce After the PullbackNVIDIA (NVDA) is currently trading around $117.06, pulling back from its recent highs of $153.13. With volatility kicking in and macro pressure (including renewed tariff talk from the Trump camp), NVDA is setting up for what could be a powerful rebound opportunity.
Here’s how I’m looking at it:
📥 Buy Zones (Scaling In):
$104 – Technical support zone where buyers may start stepping in.
$95 – Key psychological and chart-based support.
$90–$80 – Deep correction zone for high-conviction entries.
🎯 Profit Targets:
TP1: $125 – Strong short-term resistance.
TP2: $145 – Reclaiming mid-term momentum.
TP3: $153+ – All-time high retest if sentiment recovers.
💡 Why It Matters:
NVIDIA’s fundamentals are on fire: strong revenue, record margins, and leadership in AI and data center growth. Add in $25B+ in cash and minimal debt, and you've got a long-term juggernaut. Yes, it's volatile. Yes, it's overvalued on paper. But growth like this doesn’t come cheap.
📊 Risk Management:
Always use stops—especially in this kind of market. I’m keeping an eye on $90 as a make-or-break level and adjusting sizing to weather volatility.
Disclaimer: This is not financial advice. All trading involves risk. Do your own research or speak to a licensed financial advisor before making any financial decisions.

"God of AI" How does Nvidia make money?"God of AI" How does Nvidia make money?
NVIDIA is really at the center of the AI and data center boom right now. With these industries growing so quickly, it looks like NVIDIA’s sales and profits will keep going up for quite some time. Some experts even predict that by 2029, the company could be making over $300 billion just from its data center business.
What’s also impressive is how NVIDIA keeps rolling out new and better AI chips, staying ahead of the competition when it comes to technology. And they’re not just sticking to AI-they’re also moving into exciting areas like self-driving cars, the cloud, robotics, and even the metaverse. This kind of diversification gives them even mo NASDAQ:NVDA re ways to grow.
As for the stock price, most analysts seem to agree that there’s still a lot of potential for it to climb higher, even though there are some risks to watch out for-like increased competition, supply chain hiccups, or short-term market swings.
NASDAQ:NVDA
NVDA: Buy ideaOn NVDA, we are in a rising channel with a series of rebounds on the support line. This chart configuration signals a high probability of seeing the market move higher. But this will only be possible if the resistance line is forcefully broken by a large green candlestick followed by significant green volume. This indicates the entry of major buyers into the market.

Short - NVDAPrice hits a strong resistance at $123, the purple line is the danger zone from the last tariff crash.
Trend: Expect a pull back short term before forming a higher low to enter to the upside.
Elliot Wave Strategy: Expect to finish wave 5.
Support line to enter put: $112
Put option expiration 5/23/25
PT 1:~109.50
PT 2: ~105.8

NVDA Weekly Options Trade Plan 2025-05-07NVDA Weekly Analysis Summary (2025-05-07)
Model Summaries
Grok/xAI Report
Technicals: Price $117.06 above all key EMAs; bullish MACD on 5-min and daily; RSI overbought short-term (75) but neutral daily (59); trading near upper Bollinger Bands. Sentiment: VIX elevated at 24.76; mixed news (AI rally vs. supply delays); max pain at $111 suggests some bearish undertone. Direction: Moderately bullish with caution for pullback. Trade: Buy naked $113 put (premium $0.59) anticipating pullback, stop if $119 breach, target 25–50% gain, 65% confidence.
Claude/Anthropic Report
Technicals: Strong intraday uptrend; bullish MACD and RSI neutral daily; immediate resistance at $117.68. Sentiment: Sector tailwinds, positive news, but VIX elevated and max pain at $111. Direction: Moderately bullish. Trade: Buy $121 call at $0.75, profit target 100% ($1.50), stop-loss 40% ($0.45), 65% confidence.
Llama/Meta Report
Technicals: Bullish MACD, overbought short-term RSI, mixed reversal risk. Sentiment: Mixed news; VIX rising; max pain theory. Direction: Moderately bullish but immediate entry risky—overbought, mixed signals. Trade: No trade recommended at open (confidence <60%).
DeepSeek Report
Technicals: Bullish breakout, expanding bands, RSI overbought M5 but room on daily. Sentiment: Positive AI policy news; VIX manageable; max pain unlikely to derail strong technicals. Direction: Strongly bullish (70% confidence). Trade: Buy $122 call at $0.56, target $1.12, stop if $115.86 break, size 3–5% of capital.
Gemini/Google Report
Technicals: Strong uptrend but very overbought short-term. Sentiment: Mixed news with supply concerns; VIX rising; max pain $111 adds caution. Direction: Neutral/unclear for immediate trade (confidence <60%). Trade: No trade recommended at market open. Areas of Agreement and Disagreement
Agreements
All models see a strong intraday and daily uptrend with price above key EMAs and bullish MACD. Short-term RSI is overbought, suggesting potential for pullback or consolidation. VIX is elevated (~24.8), signaling caution. Max pain at $111 introduces a bearish tether toward expiration.
Disagreements
Trade selection: Grok favors a bearish put; Claude, DeepSeek favor bullish calls; Llama and Gemini hold off. Confidence: DeepSeek is most bullish (70%), Grok and Claude are moderately bullish (65%), Llama and Gemini see too many conflicting signals for immediate action. Strike selection varies widely: $113 put, $121 call, $122 call, or no trade. Conclusion
Overall Market Direction Consensus: Moderately bullish for the week, with elevated short-term risk of pullback.
Recommended Trade
Strategy: Single-leg naked call Instrument: NVDA weekly options (expiry 2025-05-09) Strike: $122.00 Call Premium: ~ $0.56 Entry Timing: At market open Profit Target: $1.12 (100% gain) Stop-Loss: $0.34 (40% loss) Confidence: 70%
Key Risks and Considerations
M5 RSI overbought (75) risks a short-term pullback. Elevated/rising VIX may induce whipsaws. Max pain suggests potential downward drift into expiration. Monitor any fresh supply-chain or sector news at open.
TRADE_DETAILS (JSON Format)
{ "instrument": "NVDA", "direction": "call", "strike": 122.0, "expiry": "2025-05-09", "confidence": 0.70, "profit_target": 1.12, "stop_loss": 0.34, "size": 1, "entry_price": 0.56, "entry_timing": "open", "signal_publish_time": "2025-05-07 20:16:47 UTC-04:00" }
Disclaimer: This newsletter is not trading or investment advice but for general informational purposes only. This newsletter represents my personal opinions based on proprietary research which I am sharing publicly as my personal blog. Futures, stocks, and options trading of any kind involves a lot of risk. No guarantee of any profit whatsoever is made. In fact, you may lose everything you have. So be very careful. I guarantee no profit whatsoever, You assume the entire cost and risk of any trading or investing activities you choose to undertake. You are solely responsible for making your own investment decisions. Owners/authors of this newsletter, its representatives, its principals, its moderators, and its members, are NOT registered as securities broker-dealers or investment advisors either with the U.S. Securities and Exchange Commission, CFTC, or with any other securities/regulatory authority. Consult with a registered investment advisor, broker-dealer, and/or financial advisor. By reading and using this newsletter or any of my publications, you are agreeing to these terms. Any screenshots used here are courtesy of TradingView. I am just an end user with no affiliations with them. Information and quotes shared in this blog can be 100% wrong. Markets are risky and can go to 0 at any time. Furthermore, you will not share or copy any content in this blog as it is the authors' IP. By reading this blog, you accept these terms of conditions and acknowledge I am sharing this blog as my personal trading journal, nothing more.


NVDA LongJust checked this stock which seems very good trade for now. With a flow of good news for the past week about the trade war between China and USA, there is a good possibility for a long trade in here. Also technically, a downtrend line has been broken, and liquidity got swept, so i cant see anything in the way of a long trade in here.
See this marked blue line, thats a down trend that got broken. Now i would be looking for this small gap to be filled and the price testing the downtrend.
Confirm on lower tf if the price would hold this trendline and wont go below it, then make an entry.

Nvidia Shows Signs of Recovery -but the Bearish Channel Remains Over the last five trading sessions, Nvidia’s stock has gained more than 9%, and short-term bullish momentum remains intact as the tech giant appears to benefit from expectations of a potential easing in trade war tariffs. Notably, the company’s CEO, Jensen Huang, recently stated that the Chinese market for artificial intelligence chips could reach $50 billion within the next two years — highlighting the importance of maintaining access to this market. This reinforces the view that a diplomatic resolution to the trade conflict is crucial for Nvidia to sustain a steady recovery.
It’s also important to note that Nvidia is scheduled to release its next earnings report on May 28, with market expectations pointing to earnings of approximately $0.88 per share. Should results meet or exceed projections, this could reignite a bullish sentiment that has been largely absent from the stock over the past several months.
Bearish channel still in play:
Since early January of this year, Nvidia’s stock has formed a steady downward channel, pushing the price even below the $100 mark at times. While a consistent upward correction is underway, it remains insufficient to confirm a definitive breakout, meaning this bearish channel is still the dominant technical structure in the short term.
ADX:
The ADX indicator has been fluctuating below the neutral 20 level, signaling a decline in volatility over the average of the last 14 sessions. As long as this continues, the current phase of price neutrality may persist.
RSI:
The RSI is showing a similar picture, hovering near the 50 level — indicating a balance between buying and selling momentum in recent sessions, and reinforcing the lack of a clear short-term trend.
Key levels to watch:
$113: Current resistance level, aligned with the upper bound of the bearish channel and the 50-period simple moving average. Continued price action in this area may extend the current phase of consolidation.
$125: A critical resistance point tied to the 200-period simple moving average. A breakout toward this level could signal the end of the bearish channel.
$100: A key psychological support level in the short term. A move below this threshold could reinforce the bearish bias and trigger a deeper downtrend within the current price structure.
Written by Julian Pineda, CFA – Market Analyst

DXY, AMZN, BABA, AAPL & NVDA Daily Trade SetupsIn this update, we review the recent price action in the Dollar Index, Amazon, Alibaba, Apple, and Nvidia and identify the next high-probability trading opportunities and price targets. To review today's video analysis, click here!

NVIDIA Massive bullish break-out after 4 months of selling.NVIDIA Corporation (NVDA) made a critical bullish break-out yesterday (in the aftermath of Meta's and Microsoft AI capex numbers) as it didn't just break above the 1D MA50 (blue trend-line) that has been intact as a Resistance since February 27 but also above the top of the Channel Down that has been the dominant pattern throughout this correction since the January 07 All Time High (ATH).
The 1D RSI is on an Inverse Head and Shoulders (IH&S) pattern, which is always bullish and if NVDA closes a 1D candle above the 1D MA50 next, then our short-term Target will be 143.50, which is just below Resistance 1 and the 2.0 Fibonacci extension.
-------------------------------------------------------------------------------
** Please LIKE 👍, FOLLOW ✅, SHARE 🙌 and COMMENT ✍ if you enjoy this idea! Also share your ideas and charts in the comments section below! This is best way to keep it relevant, support us, keep the content here free and allow the idea to reach as many people as possible. **
-------------------------------------------------------------------------------
💸💸💸💸💸💸
👇 👇 👇 👇 👇 👇

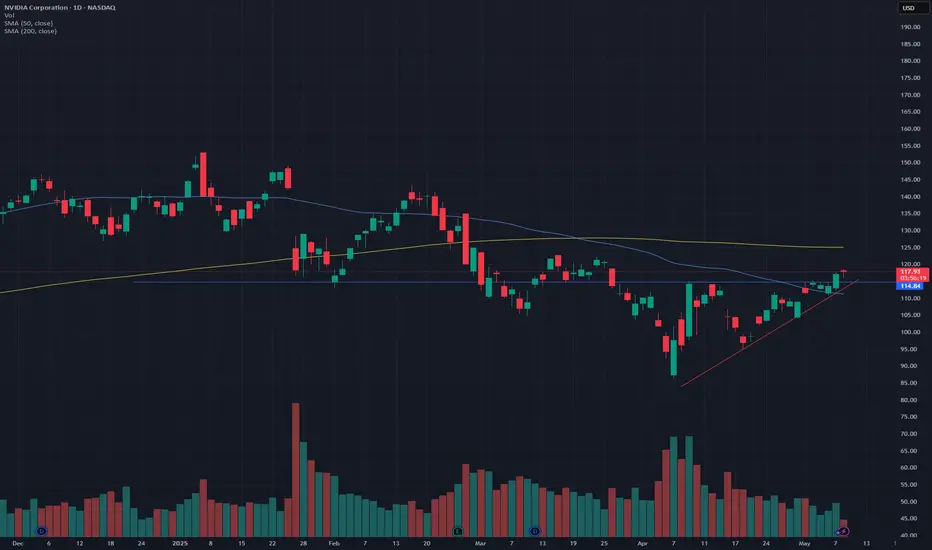
NVIDIA: Breakout above ascending triangle, retest confirmationNVDA has been forming an ascending triangle over the past few weeks, with declining volume. Finally, it broke out yesterday, and today, we had a retest of the resistance line. NVDA was down about 1% earlier today however after a successful retest of the resistance line, it is now up 0.8% at the time of writing.
In terms of support, it seems the price has successfully bounced off the 50-Day SMA line. While an ascending triangle is bullish, the 200-Day SMA is likely going to be a point of resistance (around $125).
This is amid the renewed overall market strength and the news related to the reduced limitations of exporting AI chips - which is contributing to the momentum.
Please note: Not financial advice.
NVDA Looks Ready to Pop – Here’s What I’m Watching 👀
Alright, I’ve been eyeing NVDA this week, and the setup is actually pretty clean across multiple timeframes. Let me break down what I’m seeing and what I’m thinking going into the next few sessions.
🧠 My Thought Process
So on the daily, NVDA’s been slowly crawling its way up underneath this big descending trendline. It hasn’t broken out yet, but the way it’s holding higher lows and pressing toward the top of that wedge tells me it’s gearing up. MACD’s starting to curl up, Stoch RSI is lifting — I just get the sense this thing doesn’t want to stay boxed in much longer.
I zoomed into the 1-hour, and you can see it’s still respecting that upward trendline. Price pulled back a bit but didn’t break structure — in fact, it bounced and started reclaiming some levels fast. 114–115 is the zone I’m watching. If we clear that with some conviction, I’m leaning bullish for a quick move toward 117–119.
📊 Options Flow / GEX View
Now this part gets interesting. GEX is showing some heavy call interest around 115, and that’s where we’re hovering right now. If we push above and hold, the next big call wall sits at 119, and then you’ve got the Gamma Resistance wall at 120 — that could trigger a fast pop if market makers have to start hedging aggressively.
On the flip side, HVL is at 110, so if we reject again at 115, we might get a flush down toward that level.
🛠️ How I’m Thinking About Trading It
If we break and hold over 115
→ I’ll consider grabbing some short-dated calls (maybe 117c or 119c for this week), but I’ll only size in if volume confirms.
→ Also might just scalp commons for a move to 118–120.
→ Stop would be below 112.5 or the 1H trendline.
If we reject 115 and lose 113
→ I’ll wait for confirmation, but I’d consider puts targeting that 110 HVL level. Not gonna force it though — want to see the trend shift first.
Final Thoughts
Not trying to front-run this — just letting the levels play out. But NVDA is in a pressure cooker, and it won’t stay quiet for long. I’ll be watching that 115 level closely. Above it, I’m bullish with targets at 117–119. If it stalls, I’ll sit back and wait to see if it gives a better entry off a pullback.
Let me know if you’re trading this too or seeing something different. Always down to compare notes.
Not financial advice — just walking through what I’m seeing and how I’d play it.

NVIDIA Corporation: Bullish ConsolidationThe NVDA stock is facing resistance at the 0.5 Fib. extension level. This resistance was met after a higher low and above 0.618 Fib. While this is a confirmed resistance zone, market conditions are bullish.
The RSI is now above 50. It is at its highest on a rise since late January earlier this year.
Local resistance on the RSI has been broken and this oscillator is trading straight up. This is a positive and strong signal. Here is the chart:
The yellow horizontal line is the local resistance which has been broken. On a drop, this same line would now work as support. A "magic" line I should say. :D
It is magical because it helps us predict the future with a high level of accuracy and certainty; so far so good.
These dynamics: The higher low, the small stop at resistance, the bullish RSI and overall bullish market conditions are all part of a bullish consolidation period.
Let me break it down for you; the market will continue to consolidate for a while, for as long as it needs, before moving higher to hit a new high. The conditions revealed by this chart setup is that the low that was hit 7-April remains the bottom. The market can shake, NVDA can go down, it can go up but this low will never be challenged, you can set your stop-loss below it. Any short-term movements against you is just noise. Wait patiently and eventually it will grow.
If you have any questions leave a comment it will be my pleasure to answer.
Thank you for reading again.
See you tomorrow, or the next day, or yesterday-more again.
Make sure to follow. My main focus is Cryptocurrency but I also do the SPX, NVDA and TSLA. (And sometimes Gold which is bearish now.)
Namaste.

NVIDIA supporting the bullish outlook.chart shows NVIDIA's stock price on a 4-hour timeframe. The price surged from around $80 to a peak near $150, then corrected to around $130. An ascending triangle pattern, with the price breaking below the support trendline, indicating a potential bearish move. The horizontal resistance at $31-$128 suggests a key level to watch. If the price fails to reclaim this zone, it might continue downward, possibly testing the trend line around $120. Volume spikes during the breakout and correction align with the price action, supporting the bullish outlook.
