ExhaustedThe long red candle indicates an overbought market. Despite the good economic results no new highs could be reached and the week showed beginning profit taking. Most of the market participiants are long and convonced of the good results. They are right and many of them are sitting on good profits. The more profit taking will come in here they will be thinking of taking an increasing part of their profit.
f this is true the chart picture will show a double top and a beginning bear market in the shorter time frame.
PTX trade ideas

PLTR's high chance of breaking higher highPalantir has got exceptional result in Q1 '25 with net margin increasing to 24.22% from Q4 '25's mere 9.55%
IMO, in the days full of Tariffs, we must focus on trading or investing companies whose majority customers are from the States.
Y-o-Y Growth is significant.
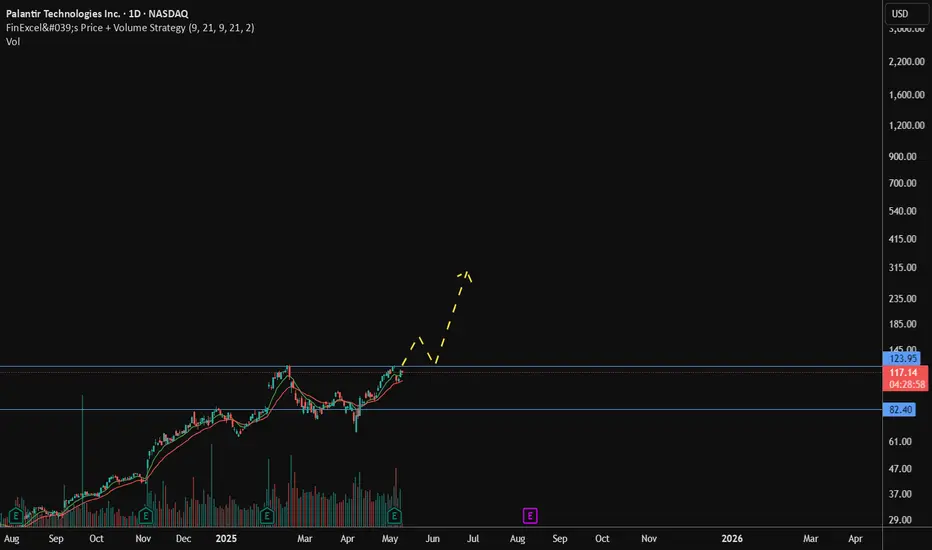
Technical part, my custom indicator has told to buy like from last year Jan, well for now, if the price action breaks the $123 price, I will wait for it to retrace to $123 and then put orders around there.
PLTR seems to be high growth
Chapter 2: “The Siege of $113” (BUY) (LONG)As the sun rose over the battlefield of the premarket, a new fire ignited in the heart of $NASDAQ:PLTR. No longer crawling beneath the walls, no longer whispering hope in the shadows — this morning, it stood tall, armor glinting, sword raised, its banner flying at $112.44.
The crowd of traders watched, holding their breath. For the first time in days, the warrior had not just broken the outer defenses…
…it was now staring down the gatekeepers of $113.
Above it loomed the yellow dashed ramparts — the fortified resistance of the bears, the final barricade before reclaiming the highlands of $114 and beyond.
Behind those walls, the bears sharpened their claws, watching the advancing price with growing unease. Their fortress had once been impenetrable. But today… cracks were showing.
And then — a surge.
The premarket volume roared like a war horn. Green candles marched forward, beating against the yellow line like a battering ram. Each tick upward was a shout:
“We’re not backing down.”
“We’re taking back what’s ours.”
The price hovered at $112.44 — tense, ready, coiled like a spring. Every trader, every algorithm, every fund manager watching knew:
This was the moment. The critical battle.

$PLTRGeo-Economic Strategy + AI = Future Power 🧠💥
As tensions and disruptions rise between India and Pakistan, this may be India’s moment to invest or partner in predictive military AI systems like those developed by $PLTR.
These systems could help anticipate operations before they unfold, protecting infrastructure & economic flow from unexpected military shocks.
Meanwhile, NASDAQ:PLTR is showing strong demand above the $80 level, supported by rising AI competition and global defense adoption.
AI isn’t just for productivity. It’s becoming a strategic weapon whoever owns the best models, owns the advantage.

PLTR Just Had a Rug Pull – Here’s What I’m Watching👀
So PLTR had a solid ru lately — we broke out of that long downtrend in April, started building higher lows, and ripped all the way to the $125 zone. But yesterday? Oof. Big red candle straight off resistance. That move flushed through the trendline and parked price right around $108 — a level we really need to hold or it starts to look weak.
🧠 My Thought Process:
* Daily Chart shows we’re still in an overall uptrend since March, but this latest pullback is sharp. MACD is starting to roll over, and Stoch RSI already crossed down. I don’t like that combination when we’re at resistance.
* 1H Chart confirms the break of the rising trendline. We dropped fast on volume, found a floor around $107–108, and now we’re just consolidating. Could be a base forming — or a bear flag.
🧲 GEX and Options Insight:
* Gamma ma shows $121–125 as the heavy call resistance zone. That’s our ceiling for now.
* On the downside, $100 is massive PUT support, and there’s a wall sitting at $98.72, which I think could be a magnet if bulls don’t step up.
* GEX is super bearish right now — three red circles, and CALL$ is up at 26.7%, meaning there’s a good amount of overhead pressure. IV rank is also high, so premiums are inflated.
⚔️ Trade Ideas I’m Considering:
1. Bearish short-term:
If we break below $107, I might go for a Put debit spread targeting $100–98. That setup keeps risk-defined and aligns with the GEX magnet zone.
2. Neutral bounce play:
If we reclaim $110+ and start seeing strength with volume, maybe a short-dated Call scalp up to $115, but I’d be quick to cut it. That GEX wall at $121 is brutal resistance.
🔁 Summary:
Right now, PLTR is at a decision zone. The bulls lost momentum, and the options flow is leaning bearish. If we get a bounce, ’m not chasing unless we clear $111–113 with strength. Otherwise, I’ll be watching for a grind lower toward $100–98.
This week might be chop, so I’ll stay nimble.
Disclaimer: This is just my view and how I’m planning. Do your own DD and manage your risk.

From Gut to Algorithm: How AI Is Changing the Game for TradersArtificial Intelligence isn't just changing tech — it’s rewriting the rules of trading and investing.
What used to be the domain of seasoned floor traders and intuition-driven bets is now increasingly dominated by algorithms, machine learning models, and predictive analytics.
Here is how AI changing the markets — and what it means for traders like you.
📈 AI in Action: How It’s Used in Markets
AI impacts trading in ways both seen and unseen. Here’s how:
Algorithmic Trading:
High-frequency trading (HFT) firms use AI to make thousands of trades per second, exploiting tiny inefficiencies.
Sentiment Analysis:
AI scans news articles, social media, and earnings calls to gauge market mood before humans even blink.
Predictive Analytics:
Machine learning models digest millions of data points to forecast stock movements, currency fluctuations, and market trends.
Portfolio Management:
Robo-advisors like Betterment or Wealthfront use AI to automatically rebalance portfolios — making decisions humans might overthink.
Risk Management:
Banks and hedge funds use AI to predict and manage market risks faster than traditional risk teams ever could.
🤖 Why AI Is a Game-Changer for Traders
AI isn’t just about speed. It's about edge.
✅ Processing Power:
AI can analyze complex patterns across decades of historical data — something a human could never do in a lifetime.
✅ Emotionless Trading:
AI doesn’t panic, get greedy, or revenge trade. It executes the plan — consistently.
✅ Adaptive Strategies:
Machine learning models evolve over time, adjusting to changing market conditions without needing a human hand.
⚠️ The Dark Side: Risks and Challenges
AI isn’t magic. It introduces new risks into markets:
Flash Crashes:
Algorithms can amplify volatility — causing sudden, violent moves like the 2010 Flash Crash.
Overfitting:
AI models might "learn" patterns that don’t actually exist, leading to disastrous real-world trades.
Market Homogenization:
If everyone uses similar AI models, trading strategies become crowded — making the market more fragile.
Ethical Concerns:
Who is accountable if an AI trader manipulates a market unintentionally? Regulators are still catching up.
🧠 What This Means for You
Whether you’re a day trader, swing trader, or long-term investor, understanding AI is becoming a competitive necessity.
Retail traders are starting to access AI-powered tools once reserved for institutions.
Custom indicators, predictive models, and smart portfolio managers are more available than ever.
But remember: AI is a tool, not a crystal ball.
Human judgment, risk management, and emotional discipline still matter.
In the end, the best traders will be those who can combine machine intelligence with human intuition.
in conclution:
Markets have always rewarded those who adapt.
AI isn’t replacing traders — it’s changing what trading looks like.
The future belongs to those who can learn faster, adapt smarter, and trade sharper.
Stay curious.
Stay strategic.
Stay ahead.
put together by: @currencynerd
courtesy of: @TradingView

Down to 70$ ?The quarterly report just above expectations
P/E ratio over 600
The double top on the chart
The spending cuts by the US government, which is the main client
All the ingredients are there for a significant decline that could go down to the blue support where the 200-day SMA (blue line) will be located, around $70.

Pltr $151 🧠 Palantir Bull Thesis: $136–$150 Short-Term Target (Post-Earnings)
Price Target Range:
Base Target: $136
Stretch Target: $150 (if momentum breakout + macro align)
Catalyst 1: AI/Defense Earnings Blowout
Expected EPS: $0.13 → if actual EPS surprises (e.g., $0.15+), it signals significant operating leverage from AI/Foundry.
Recent Government Deals: NATO, U.S. military, and foreign defense contracts bolster revenue visibility.
Commercial Growth Spike: Analysts expect over 60% YoY growth in commercial sector revenue — if confirmed, valuation multiple expansion becomes justified.
Catalyst 2:
Cup & Handle breakout formed over the last 6 weeks
Break above $124 (previous high) triggers bullish continuation
RSI is resetting from mid-60s — giving room for a momentum ignition
Golden cross: 50EMA crossing above 200EMA last week
📊 If earnings gap the stock above $128, short-covering + AI momentum chase can push a rapid breakout to $136–$150.
Catalyst 3: Options Flow + IV Crush Setup
Implied Volatility > 95% pre-earnings → massive call open interest buildup at $130–$150
Call/Put ratio above 2.3 (bullish skew)
If IV collapses post-earnings and the move is directional, market makers will need to hedge deep OTM calls → gamma squeeze potential
Catalyst 4: Sentiment + Social/Institutional Attention
Palantir trending on Reddit, Twitter, and TikTok
Citadel and BlackRock increased positions in Q1
High institutional ownership (~40%) with increasing fund inflows into AI/Defense names
Quantum Forecast & AI Narrative Momentum
AI stocks (NVDA, SMCI) have led market-wide rallies
Palantir being seen as the “AI software layer for government + enterprise”
CEO Alex Karp has already hinted at "transformational government contracts" and new AI modules — this creates anticipation buying even before guidance is raised
Risk-Reward Snapshot
Case Price Range Probability
Base Bull Case $136 55%
Stretch Case (Gamma Squeeze + Beat + Upgraded Guidance) $150+ 30%
Neutral Post-Earnings Drift $118–124 15%
Risk Factors:
Market-wide risk-off event (Fed, macro surprise)
AI rotation cools off
EPS beats but guidance disappoints
IV crush limits upside unless price gaps violently
If Palantir beats EPS by >15%, raises guidance, and gaps over $128 post-earnings, a momentum/gamma squeeze could push it toward $136–$150, fueled by AI mania, defense exposure, and short positioning.
Want a matching chart or visual post for this thesis?
as always safe Trades

TD 9 Sell Setup almost cooked High of today's candle gonna be a setup trendline for current sequence. Doesn't guarantee price drop but at least it may end up with 1-4 candle correction. As I post before I've already took some short position last Friday.

PLTR, It's Been RealAt a high of 125, it's had a great run, but a double top has formed going into earnings and a US government which may be forced into austerity. Insiders have been selling for months with no net buys
- First Price target down to the neckline at 76
- Next price target would be 42 for the last real breakout test
- Final PT would be 24 if the double top played out completely

Harmonic Shark Pattern and Palantir's Stock CorrectionBased on harmonic analysis, specifically the Shark pattern, the price of Palantir (PLTR) stock may face a potential decline from the $129 mark.
This projection hinges on the identification of a completed Shark pattern, indicating a possible reversal zone.
Within this framework, the Fibonacci ratios of 0.88 and 1.138 are critical levels to observe.
The 0.88 retracement level suggests a potential area for a first retest and possible bounce, while the 1.138 level represents the pattern's leading edge, indicating a possible reversal point after a more significant extension.

Good PalantirianNoticed recently there is very few NASDAQ:PLTR stock for sale on the market. As a good and kind trader I decide to borrow ad sell couple of NASDAQ:PLTR like a good move to provide liquidity to the market and help other traders to obtain so passionately desired Palantir stock.
Dear Palatirians pls don't get me wrong. I'm not betraying our faith, just need to step back for a while

SHORT AGAIN 100 95run it back they still dont make enough money for this valuation risky short yet again. grabbed may 23 100 90P

PLTR: Buy ideaBuy idea on PLTR as you can see on the chart after the breakout with force the resistance line by buyers.

Don't hate me... 240 for 2025I know it doesn't make sense, and perhaps there'll be a sizeable correction afterwards. But we have momentum. And the AI bandwagon could not be larger (maybe it can...).
All I'll I can say is. Don't short this stock. Lest ye be remitted to your coke lines in your motel 6 rooms. Mind the drones spraying light fentanyl-laced urine.
All the best.

Quick View: $PLTREMA21 crossed above EMA50 and pulled back.
Box right now on the go.
Watching for a #TopSwing Setup
Area of $121 as key resistance.
Support → $114 and $104

Chapter 5: “Operation: Break the Ceiling" (Buy) (Long)The sky was quiet.
Too quiet.
A calm so perfect it made the watchers uneasy.
Price hovered in the highlands of $121, just beneath the outpost towers of $124 —
not pressing, not charging…
simply present.
But beneath that calm…
a mission was unfolding.
A silent infiltration.
The bears had fallen into rhythm.
Their sentries lined the upper fortresses,
comforted by routine.
Sell walls rested like rusted armor at $123… $124… $126.
Nothing unusual.
Nothing alarming.
They had seen bulls climb before — loudly, predictably, emotionally.
But this time…
there was no climbing.
This time,
the bulls were already inside.
They had entered beneath the surface —
not with volume,
but with silence.
Their movements did not trigger alerts.
Their footprints were traced in subtle accumulation,
their weapons hidden inside passive bids and split spreads.
One by one, they infiltrated the upper levels of the chart,
moving through forgotten gaps,
nesting in the creases of illiquidity,
planting their charges .
They weren’t here to trade.
They were here to detonate .
The structure had been compromised.
What looked like sideways movement
was merely preparation.
A disguise.
A mask worn by momentum itself.
They moved with purpose —
not to break resistance,
but to shatter expectation .
The white ascending line arched above them like a tensioned wire.
Beneath it, the bulls crawled like operatives through the ductwork of the market.
And at the center of their plan
sat the payload —
a momentum surge wired to explode
beneath $124… and aimed directly at $129 .
The bears sensed it.
But they didn’t know what “it” was.
They reinforced their walls.
They adjusted their orders.
But they were guarding against noise…
not ghosts .
And then,
without sound, without volume, without warning...
one candle blinked .
It wasn’t large.
It wasn’t dramatic.
But it was perfect.
It sliced upward, clean as a blade.
And in that moment,
everything changed.
The white path lit up.
The tape rippled.
The chart cracked.
Price surged.
Not wildly —
surgically.
$122.60…
$123.80…
$124.90…
Each level breached with clinical precision,
as if it had been drawn,
practiced,
rehearsed.
And through it all,
no bull said a word.
From below, traders watched in disbelief.
“It’s flying—
But there’s no panic.
No chasing.
No… noise.”
Because it wasn’t hype.
It wasn’t FOMO.
It was execution.
And now, as the dust settles,
the operation continues.
The white line has curved again.
The last red band nears.
And just ahead,
above the final towers,
veiled in pre-detonation quiet —
stands $129.
The thirteenth gate.
The last stronghold.
And the final objective in this phase of the mission.
They’re not done.
They’re not loud.
They’re just getting closer.
Mission status: underway.
Next objective: breach confirmed at $129

Somebody is cleaning house.The key to whether this happens will be in the rapid pace at which shorts take hold here. Talk about narrative, I can't imagine what stories we will be told while they continue the SWEEP all the way down to $61.00. You might not fall for the narrative they try to sell you on, but $61.00 will be a hard pill to swallow if you're just picking up shares now, to say the least.
Now they may SWEEP the high liquidity again before they hit the lows, but I would almost guarantee you that is the next target.

PLTR 114.51Watch retest for long position at 114.51.
Position is looking clean for a nice break and retest setup. Keep in mind the larger market at whole to ensure price action confirms the move.

Palantir Goes to Repeat Tycoon Buffett Early 1990s AchievementSomewhere in another Galaxy, in late December, 2024 (yet before The Second Coming of Trump), @TradingView asked at it awesome Giveaway: Happy Holidays & Merry Christmas.
1️⃣ What was your best trade this year?
2️⃣ What is your trading goal for 2025?
Here's what we answered:
1️⃣ What was your best trade this year?
- Surely Palantir NASDAQ:PLTR 💖
I followed Palantir all the year since January, 2024, from $16 per share, watch here .
Current result is 5X, to $80 per share.
Also I added more Palantir after SP500 Index inclusion in September 2024 watch here .
Current result is 2.6X, from $30 to $80 per share.
2️⃣ What is your trading goal for 2025?
- Once again, surely Palantir NASDAQ:PLTR 💖
It's gone 4 months or so... (Duh..? Ahaha.. 4 months, really? 😸😸😸)
Let see what's happened next at the main graph PLTR/SPX
First of all, let me explain in a few words what does this graph mean.
Rising (Blue) candle means Palantir NASDAQ:PLTR monthly return is better vs SPX
Falling (Red) candle means Palantir NASDAQ:PLTR monthly return is worse vs SPX
Conclusion
Palantir. The stock that outperformed S&P 500 Index, 11 consecutive months in a row.
Palantir. The stock that printed 11x since inception. 5.5x over the past twelve month and 1.5x in the year 2025 (the best one result so far over the all S&P 500 Index components).
Palantir. The stock that goes to repeat Tycoon Buffett achievement early 1990s (in 1992-93 Berkshire Hathway outperformed S&P 500 Index for a straight TWELVE MONTHS.
Palantir. Were we right with this stock on contest and won it? Exactly! Even though our prize has been toadly strangled. 🤭
--
Best wishes,
Your Beloved @PandorraResearch Team 😎

White ripster chart ideas copy chart settins publicshWhite ripster chart ideas copy chart settins publicsh public share

$PLTR Update: New Long Entry at $82 in a Strong Uptrend!Palantir Technologies Inc. ( NASDAQ:PLTR ) continues its “Strong Uptrend” on a 1-week chart. 📈 We bought at $21.84 and sold at $121.81 previously. Now at $114.65, we’ve entered a new long position at $82. The Trend Score is 8/8, but a short-term projected price of $123.2 ( -9.1% ) and bearish MACD suggest a potential pullback.
How to Trade This Setup:
• Monitor the Trend: The uptrend is strong with high volume, but bearish signals indicate caution—watch for momentum shifts.
• Set Targets: Resistance 1 at $137.66 is a target; Support 1 at $75.65 is key if a pullback happens.
• Adjust Risk: With bearish MACD, consider tightening stops or taking partial profits from $82.
What’s your next move on NASDAQ:PLTR ? Let’s discuss in the comments! 💡 #Trading #PLTR #Analysis

PalantirPalantir has continued to push higher, but if you look at MACD, it is running into resistance. Also, it is within the white target box for an impulsive wave, and has officially hit the yellow 1.0 if it is to be an abc pattern for the (a) of minor B. Due to the impulsive looking structure it seems to be turning into, and the duration/level of this move higher, I am officially making the bullish count my primary. That being said, the yellow count can still play out, but given the current price action and time duration, I find the white count most plausible.
We're due for a consolidation lower regardless of what count comes to fruition. Both patterns point to an abc move next to the $80 area if it is to be standard. The part that comes after that is what will answer the question of which count is correct. Once we get that move lower, if it is in the form of an abc, I will try to enter into a long position around the 0.618 retracement fib. That will be the least risky place to enter.
If the white count is what is playing out, then a minor wave 3 will come after the consolidation lower. If the yellow count is to play out, then it will be a minor C wave that takes us to the $120's. Either way you look at it, I am forecasting price to move significantly higher after our next move lower.
Let me know if any questions linger. I have added an orange label above the white box to signify we can still very easily get another high for minor wave 1. Once we do have a top in, I will add some retracement fibs to track the move lower.
