TL0 trade ideas

Tesla: More Room in Wave 4With the recent increases, TSLA approached the more significant local high from early April. Although we locate the price in a turquoise downtrend impulse, the internal corrective upward move of wave 4 still has some more room. With the following wave 5, the stock should then fall below the support at $215.01 to complete the magenta wave (3), which is also part of a downtrend impulse. Meanwhile, our alternative scenario suggests a much faster progression. We consider it 27% likely that with the low on April 7, the blue wave alt.(II) and thus the major corrective movement have already ended. In this case, the path would be clear for a new uptrend of the blue wave alt.(III), which would lead to increases above the resistance at $488.50. Primarily, however, we expect the corrective movement to conclude at a later time and at lower levels.

TSLA Eiffel Tower Not CompleteEiffel tower patterns are rare but very powerful TA structures when they develop.
They are very hard patterns to short since we can never know when the wave up ends. However, there is so much information we can extract from them during and after the collapse.
When they are rising and going vertical, and you happen to be in it. The benefits will be great! As the price action sucks in everyone all at once with virtually no sellers.
So, what info can we learn?
On the way up, when this is happening, you should have the ability to recognize it at some point without worrying if you got the top. Take your money and RUN!
Never try to get back in and try to chase it up!
Never try to short it, thinking it is too high, this is the top!
When it tops out, never buy the dip! Bc you know how this structure will end.
Never buy based on some silly FIB or bc it's down too much!
Never buy the base thinking it will go back to new all-time highs, and it is now safe to get back in bc it will only keep going lower, more through time, frustrating you until you puke it up.
So remember this gimmicky sound bite.
"If they don't scare you out, they will wear you out!"
Ain't nobody got time for that! Your money has a much better place to be allocated to make you money instead of being fixated on a chart like this.
The reason people get stuck is bc the move provoked emotion! Then, when they get involved thinking they will be Buffett tomorrow from this one trade, they will experience Euphoria, sadness, anger etc., further provoking even more emotions to the point they become obsessed! Guessing, waiting, hoping, doubling down on and on...
Ask me how I know! hahaha!
While I made a lot of money shorting GME, here is an example of an Eiffel tower with many, many people that have this trading disease I just spoke about.
In conclusion, anyone who believes that TSLA will hit $1,000 blah blah blah and suckered into buying it. You now know you are being honey dicked by a bunch of armatures and bots on X. Beyond TSLA there are many such charts out there tight now that have formed the beginnings of ET. As such, you should know how to recognize it quickly and avoid the pitfalls out there.FYI I called the Top on TSLA ))
Click Like, Follow, Subscribe to learn much more about real macroeconomics and technical analysis. Let me help you navigate these crazy markets.

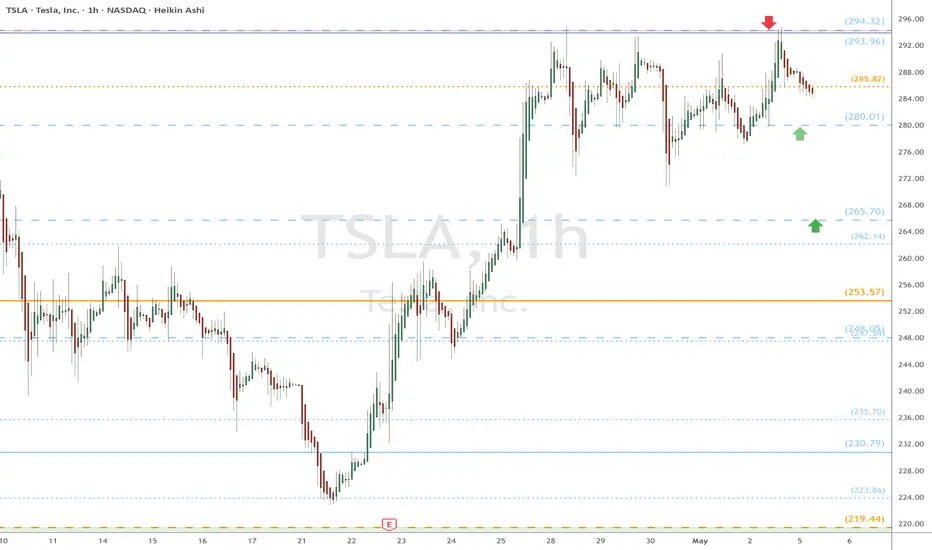
TSLA eyes on $294: Proven Resistance that bulls MUST break NOW TSLA back to a critical double fib resistance $293.96-294.32
Bulls MUST break and retest this as support and do it right now.
Any weakness could give a dip to fibs below at $280.01 or 265.70
Swing Trade Plan for TSLA (as of $285)TSLA has rallied from its previous consolidation zone and is approaching a potential resistance area between $290–$295. Momentum is solid, but RSI and volume trends may suggest we’re nearing short-term exhaustion.
✅ Strategy 1: Wait for the Pullback (Safer Play)
Entry zone:
• $240 – Ideal level near former resistance turned support
• $215 – Strong support with higher reward potential
Stop-loss:
• Below $200 (to protect against deeper trend reversal)
Profit targets:
• $265 – Conservative
• $290 – Re-test zone
• $355 – Bullish breakout continuation (if sentiment remains strong)
This setup gives room for the price to breathe and positions you after a healthy correction.
⚡️ Strategy 2: Momentum Breakout Trade (Aggressive)
Entry:
• On breakout above $295 with volume confirmation
Stop-loss:
• Below $280 (tight, breakout failure protection)
Target:
• $320, $340+, depending on follow-through
This is higher risk, higher reward — you’re betting on bulls continuing the charge without a pullback.
⚠️ Disclaimer: This is not financial advice. Trading involves risk. Always do your own analysis and trade with proper risk management.

TSLA Setting Up for a Big Move?🔎 Big Picture (1D Chart)
TSLA had a solid bounce off that $138–$140 range back in April, and we finally got the trendline break to the upside. But right now… we’re kinda pausing. Price stalled below $280, and the MACD looks like it's rolling over a bit. Also noticed Stoch RSI curling down — not great if you're expecting momentum continuation.
We’re sitting in this tight range just above prior structure — it feels like the market is waiting for something.
🕒 Zooming In (1H Chart)
1H shows a bit more chop than I’d like. There’s clearly some pressure under $278 and buyers haven’t stepped in aggressively. That trendline break we had from April is still valid, but price is walking sideways. Kinda reminds me of distribution vibes unless we reclaim that $284–$286 area quick.
MACD is flat, and Stoch RSI bounced from oversold but isn’t convincing just yet.
🧠 Options Flow + GEX Insight
This is where it gets really interesting…
* Gamma Wall / Call Resistance: $297.50–$300 is the GEX lid. Tons of calls stacked there — if TSLA starts squeezing, that’s the magnet.
* PUT walls: Strongest net negative GEX is at $270, followed by $260. That makes $270 my short-term line in the sand — if we lose it, volatility probably spikes fast.
* HVL (High Volume Level): Lined up with $275–$278 zone. That’s right where price is dancing now.
💡 So the GEX map shows we’re trapped between a wall and a floor. Could be a coil before a breakout — or a fakeout flush before a rip.
💬 My Game Plan
Honestly, I'm playing this one day by day. Here’s how I’m thinking about it:
Scenario A – Breakout
* Entry: $285+ reclaim with volume
* Target: $297.50, then $300
* Options idea: Weekly 290C or 295C lotto if IV stays tame
Scenario B – Breakdown
* Entry: Below $270 with momentum
* Target: $260 zone
* Options idea: 265P or a debit put spread targeting $260 if VIX is friendly
Neutral Trade
* I might scalp inside this range ($270–$280), but it’s tricky. If I see chop, I sit. No reason to force it.
📌 Final Thought
TSLA looks like it’s prepping for something — we’re at a balance point between option pressure and fading momentum. If you’re a scalper, be nimble. If you’re swinging, this might not be the cleanest entry just yet. But when it moves, it’ll move fast.
Trade smart. Protect your capital.
This post is just my view — not financial advice. Do your own research and stay sharp out there!

$TSLA Pullback Soon?Tesla's recent announcement of its upcoming robotaxi service and the unveiling of the Cybercab have generated significant investor enthusiasm, contributing to a notable surge in TSLA's stock price. However, while these developments are promising for Tesla's long-term vision, they may not provide sufficient support for the current elevated stock levels in the short term.
Competitors like Waymo and Zoox have already established operational autonomous ride-hailing services in select markets, potentially challenging Tesla's market entry and adoption rates.
Despite recent relaxations in federal self-driving regulations, Tesla's autonomous services must still navigate a complex landscape of state and local laws, which could impact the pace of deployment and revenue realization.

TSLA Bull CaseIf TSLA can put in a solid close above the 200sma and downtrend line I am bullish for the short-mid term at least up to the .38 fib at $320.

Tesla Target: $1500Tesla Mega Setup Alert
NASDAQ:TSLA is forming a rare double cup & handle on monthly chart
Accumulation phase ending
Entry zone: $270–280
Target: $1500–$2000 in 2 years
10x potential if structure plays out!
Don't blink 👀
#Tesla #TSLA #ElonMusk #StockMarket #Investing

TSLA looks tired295 is seemingly the tough level. I was just praising TSLA for turning slightly bullish too. We rejected pretty hard Fri 5/2.
<285, 280, 275, 270... may even take out 265. I definitely think that TSLA is trying to hold the range and not breakdown. Stay conscious of each level if you are playing it and take profit.
FOMC Wed 5/7. I think that may determine a lot of opportunities for end of week.

TSLA Potential Post Tariff Resolution Bullish RallyDespite uncertainty still looming over the current global tariff based environment, TSLA price still seems to exhibit signs of a potential Bullish breakout as the price action may form a prominent Higher Low on the longer timeframes with multiple confluences through key Fibonacci and Support levels which presents us with a potential Non-Leverage hold opportunity.
Entry: CMP 292
Stop Loss: 90 or 0 (depends on trading style as Non-Leverage Buy & Hold is recommended)
Potential Range for Targets: 470 - 550

Tesla (TSLA) 4-Hour Chart Analysis: BBofVWAP Strategy in ActionTesla Inc. (TSLA) has been gaining strong momentum lately, and on the 4-hour chart, my BBofVWAP strategy has shown a notable signal. In this post, I’ll walk through how this custom strategy works and what the latest price action could mean for traders.
🔍 What is the BBofVWAP Strategy?
The BBofVWAP (Bollinger Bands of VWAP) strategy I use combines two powerful tools:
VWAP (Volume-Weighted Average Price) – to anchor the trade bias
Bollinger Bands – to track volatility and determine key exit points
Here’s how it works:
✅ Entry Point: When VWAP crosses above the Pivot Point and stays within the Bollinger Bands.
💡 Exit Condition: VWAP crossing below the lower Bollinger Band signals an exit.
💰 Profit Booking:
Partial profits are taken near R3 resistance level
Or when the price drops below the upper Bollinger Band
This method filters out noise and rides trends effectively while maintaining solid risk management.
📊 Current TSLA Chart Insight (4h)
In the current 4-hour setup:
We entered the trade at a pivot breakout (highlighted with a blue arrow on the chart).
VWAP continued to trade within the Bollinger Bands, keeping the position alive.
Price has climbed toward $287.25 and is hovering near key resistance levels.
R3 (328.92) acts as a potential profit-taking zone.
If VWAP crosses under the lower band, we’ll be out – clean and disciplined.
📌 Why This Strategy Works
🎯 Clear rules-based system for entries and exits
📉 Eliminates emotional decision-making
⚖️ Balances trend-following with mean-reversion logic
🔁 Works well across large-cap, high-volume stocks like TSLA
🧠 Final Thoughts on TSLA Setup
Tesla’s recent strength, combined with this BBofVWAP setup, gives a bullish but cautiously managed outlook. As always, managing risk with technical levels like VWAP, Pivot Points, and Bollinger Bands provides a more structured approach to volatile tickers.

9 Simple Ratios Every Great Investor Uses - Buffett Included!Forget the hype, headlines, or hope. These 9 financial ratios are what real investors actually use to pick winners, but...
P/E? ROE? EPS? 🧐
- What are they, or better yet, WHO are they? 🤯
- How high is “too high”?
- Is a low number always good, or just a trap?
- Do all industries follow the same rules… or is that another myth?
Buffett. Greenblatt. Graham. Lynch.
They didn’t rely on vibes — they trusted fundamentals
After years of relying on charts, I built a 9-point fundamentals checklist to filter stocks faster and smarter. Now I’m sharing it with real-life examples and key insights to help you spot what really makes a stock worth owning:
Easy enough for new investors diving into fundamentals
Sharp enough to level up seasoned pros
Real enough to avoid hype
…but the truth is: these numbers did flag companies like Amazon, Apple, and Nvidia before the market gave them credit.
-----------------------------------------------------
✅ Quick Reference Table
Scan the table, then dive into the stories…
First Pro Tip: Bookmark this. You’ll check these before every stock pick.
-----------------------------------------------------
📊 1. P/E Ratio | Price-to-Earnings
What it tells you: How much you pay for each dollar of a company’s profit.
Short Example: A P/E of 20 means you pay $20 for $1 of profit. High P/E? Expect big growth or risk overpaying.
Strong: Between 15 and 25
Caution: Above 30 (unless fast growth)
Industry Averages:
- Tech: 25–40
- Utilities: 10–15
- Consumer Staples: 15–20
- Energy: 10–20
- Healthcare: 20–30
Story: In early 2023, NVIDIA’s P/E ratio hovered around 25, near the low end for tech stocks. Investors who saw this as a steal amid the AI boom were rewarded—NVIDIA’s stock made 4x by the end of 2024 as AI chip demand soared.
Contrast that with Tesla in Q1 2025, when its P/E spiked above 40 with slowing sales and Tesla’s stock dropped 50% in weeks.
Pro tip: A low P/E is not always good. If growth is weak or falling, it's often a trap.
Example: A utility company with a P/E of 30 is probably overpriced. A tech stock with 35 might still be fair — if growth justifies it.
-----------------------------------------------------
🧠 2. PEG Ratio | Price-to-Earnings-to-Growth
What it tells you: If a high P/E is worth it based on future profit growth. Whether the earnings growth justifies the price.
Short Example: A PEG below 1 means you’re getting growth at a fair price. High PEG? You’re overpaying.
Strong: Below 1
Caution: Above 2
Industry Averages:
- Software: below 1.5 is solid
- Consumer Goods: Below 2 is more realistic
- Tech: Below 1
- Consumer Staples: Below 1.5
- Healthcare: Below 1.2
- Financials: Below 1.5
- Energy: Below 1.3
Story: In mid-2022, Salesforce’s PEG was 0.8 (P/E 35, forward EPS growth 45%) as cloud demand surged. Investors who spotted this steal saw the stock climb 130% by the end of 2024. Meanwhile, Peloton in 2023 had a P/E of 20 but near-zero growth (PEG above 3). Its stock cratered -50% as fitness trends faded.
Story: NVIDIA’s PEG hit 0.9 in Q3 2023 (P/E 30, growth 35%) during AI hype, a steal for tech (average PEG below 1.2).
PEG filters hype. A stock can look expensive until you factor in growth.
-----------------------------------------------------
🧱 3. P/B Ratio | Price-to-Book
What it tells you: How much you pay compared to what the company owns (like buildings or cash).
Short Example: A P/B below 1.5 means you’re paying close to the company’s asset value. High P/B? Expect strong profits or risk.
Strong: Below 1.5
Caution: Below 1 + poor earnings = value trap
Industry Averages:
- Banks: Below 1.5
- Insurance: Below 1.3
- REITs: Use NAV (aim below 1.2)
- Tech: Often ignored
- Energy: Below 2
Story: In 2024, JPMorgan Chase’s P/B was 1.4, solid for banks (average below 1.5). Investors who bought enjoyed 100% gains.
n 2023, Bed Bath & Beyond’s P/B fell below 1 with collapsing earnings. It looked cheap but filed for bankruptcy that year.
Tip: Only use this in asset-heavy sectors like banking or real estate.
-----------------------------------------------------
⚙️ 4. ROE | Return on Equity
What it tells you: How well a company turns investor money into profits.
Short Example: An ROE above 15% means the company makes good money from your investment. Low ROE? Weak returns.
Strong: Above 15%
Caution: Below 10% unless in slow-growth industries
Industry Averages:
- Tech: 20–30%
- Consumer Staples: 15–25%
- Utilities: 8–12%
- Financials: 10–15%
- Healthcare: 15–20%
Story: Coca-Cola (KO) has kept ROE above 35% for years, a sign of brand power and pricing strength.
Eli Lilly’s (LLY) ROE stayed above 25% from 2022–2024, a healthcare leader (average 15–20%). Its weight-loss drug Mounjaro drove consistent profits, lifting the stock 150%+ in two years. Checking ROE trends helped investors spot this winner.
Tip: If ROE is high but D/E is also high, be careful, it might just be leverage.
-----------------------------------------------------
💰 5. Net Margin | Profitability
What it tells you: How much profit a company keeps from its sales or what % of revenue ends up as pure profit.
Short Example: A 10% margin means $10 profit per $100 in sales. Low margin? Tough business or high costs.
Strong: Above 10-15%+
Caution: Below 5%
Industry Averages:
- Software: 20–30%
- Retail: 2–5%
- Manufacturing: 8–12%
- Consumer Staples: 10–15%
- Energy: 5–10%
- Healthcare: 8–15%
Story: Walmart’s (WMT) 2% net margin looks tiny — but it’s expected in retail.
A software firm with 5%? That’s a warning — high costs or weak pricing.
In 2023, Zoom’s (ZM) net margin fell to 5% (down from 25% in 2021), well below software’s 20–30% average. Pricing pressure and competition crushed its stock quite a lot. Meanwhile, Apple’s 25% margin in 2024 (tech average 20%) remained a cash cow.
Tip: Margins show whether the company owns its pricing or competes on price.
-----------------------------------------------------
💣 6. D/E Ratio | Debt-to-Equity
What it tells you: How much debt a company uses compared to investor money.
Short Example: A D/E below 1 means more investor cash than debt. High D/E? Risky if profits dip.
Strong: Below 1
Caution: Above 2 (except REITs or utilities)
Industry Averages:
- Tech: 0–0.5
- Industrials: 0.5–1.5
- REITs: 1.5–2.5 (manageable due to structure)
- Utilities: 1–2
- Energy: 0.5–1.5
Story: In 2024, Tesla’s D/E dropped below 0.3 (tech average 0–0.5) as it paid down debt, signaling strength despite sales dips - a massive rally afterward.
Tip: Rising debt + falling profits = a storm coming. Always check both.
-----------------------------------------------------
💵 7. Free Cash Flow (FCF)
What it tells you: Cash left after paying for operations and growth investments.
Short Example: Apple’s $100 billion cash pile in 2024 funded stock buybacks, boosting shares. Low cash? Trouble looms.
Strong: Positive and growing
Caution: Negative for multiple years
Sector notes:
- Tech: Lots of cash (think billions)
- Industrials: Up and down, check trends
- REITs: Look at FFO (cash from properties), aim high
- Energy: Has cash, but swings with oil prices
- Healthcare: Steady cash, not too high
Story: Netflix had negative FCF while scaling content. Once costs stabilized, FCF turned positive and stock re-rated sharply.
Pro tip: Profits don’t mean much without real cash. FCF is often more honest.
Cash is king: Companies need cash to pay bills, reduce debt, or fund growth. If FCF is falling, they might be burning through cash reserves or borrowing, which isn’t sustainable.
Potential issues : This mismatch could signal problems like poor cash collection, heavy spending, or even accounting tricks to inflate profits.
-----------------------------------------------------
🚀 8. EPS Growth | Earnings Power
What it tells you: How fast a company’s profits per share are growing.
Short Example: EPS up 10% yearly means more profit per share, lifting stock prices. Flat EPS? No growth, no gains.
Strong: Above 10%
Caution: Below 5%, flat/negative for 3+ years
Industry Averages:
- Tech: 15–30%
- Staples: 5–10%
- REITs: 3–6% (via FFO growth)
- Healthcare: 10–15%
- Financials: 5–10%
- Energy: 5–15% (cyclical)
Story: In Q1 2024, NVIDIA’s forward EPS growth of 30% (tech average 20%+) fueled a rally as AI chips dominated. Checking forward estimates helped investors avoid traps like Intel, with flat EPS and a drop.
Pro tip: A stock with flat EPS and no dividend? There’s no reason to own it.
-----------------------------------------------------
💵 9. Dividend Yield | Passive Income
What it tells you: How much cash you get yearly from dividends per dollar invested.
Short Example: A 3% yield means $3 per $100 invested. High yield? Check if it’s sustainable.
Good: ~3–4%
Red Flag: Above 6% with a payout ratio above 80-90%
Industry Averages:
- Utilities: 3–5%
- REITs: 3–6%
- Consumer Staples: 2–4%
- Tech: 0–2%
- Energy: 2–5%
-----------------------------------------------------
💡 Final Thought: How to Use All of This
Top investors don’t use just one metric. They look at the whole picture:
Good growth? Check PEG.
Good profits? Confirm with ROE and margin.
Safe balance sheet? Look at D/E and cash flow.
Fair valuation? P/E + FCF Yield + P/B.
Real power = Combining metrics.
A company with P/E 15, PEG 0.8, ROE 20%, low debt, and positive FCF? That’s your winner.
A stock with P/E 8, but no growth, high debt, and negative cash flow? That’s a trap.
-----------------------------------------------------
Real-World Combos
🎯Winners:
Tech Gem: P/E 20, PEG 0.8, ROE 25%, D/E 0.4, growing FCF, EPS 20%+ (e.g., NVIDIA 2023: AI-driven growth, stock soared).
Energy Steal: P/E 15, P/B 1.5, FCF positive, Dividend Yield 3.5% (e.g., Chevron 2023: Cash flow king).
⚠️Traps:
Value Trap: P/E 8, flat EPS, D/E 2.5, negative FCF (e.g., Peloton 2023).
Overhyped Tech: P/E 50, PEG 3, Net Margin 5%, D/E 1.5 (e.g., Rivian 2024).
-----------------------------------------------------
🚀 Share your own combos!
What do you personally look for when picking a stock?
If you spotted something off in the numbers, or have a valuable insight to add — please, drop it in the comments.👇
💡 Let’s turn this into a thread that’s not just good but superb and genuinely helpful for everyone.
-----------------------------------------------------
Final Thought
“Buy great companies at fair prices, not fair companies at great prices.” – Warren Buffett
This guide gives you the map.
Charts, tell you when.
These numbers tell you what, and why.
And this post?
It’s just the beginning!
These 9 metrics are part one of a bigger series I’m building — where we’ll go even deeper, with more advanced ratios, smarter combos, and real case studies.
If this guide helped you see financial numbers a little clearer, there’s a good chance it’ll help your investor friend too, especially if they’re just starting their journey...🤝Share it with them!
I built this as much for myself as for anyone else who wants to get better.👊
If you made it this far — thank you! 🙏
...and super thankful if you hit "The Boost" on this post 🚀
Cheers,
Vaido

TSLA | Buy @LTP | SL below 240 | 1st Target 360⚡ Tesla (TSLA) – Breakout from Demand Zone, Big Upside Potential
TSLA recently respected the strong demand zone around $220–$240 and has bounced sharply with increasing volume, signaling renewed buying interest. Price has now cleared immediate resistance and is forming higher lows a bullish sign.
📍 Entry: $282.16
🎯 Targets:
TP1: $330 (mid-level)
TP2: $367.34 (major resistance zone)
❌ Stop-loss: Below $242.79
This setup offers an excellent risk-to-reward ratio with a potential breakout rally if broader market sentiment supports tech.
Volume spikes confirm accumulation, and momentum indicators are likely flipping bullish. Keep an eye on price action near $300 for further confirmation.

Market appears supportive of Tesla's growth prospects**Direction:** **LONG**
**LONG Targets:**
- **T1 = $287.50**
- **T2 = $295.25**
**Stop Levels:**
- **S1 = $275.00**
- **S2 = $268.75**
---
**Wisdom of Professional Traders:**
This analysis synthesizes insights from thousands of professional traders and market experts, leveraging collective intelligence to identify high-probability trade setups. The wisdom of crowds principle suggests that aggregated market perspectives from experienced professionals often outperform individual forecasts, reducing cognitive biases and highlighting consensus opportunities in Tesla.
**Key Insights:**
Tesla continues to dominate the EV sector with substantial global market share and expanding demand across multiple territories. It has consistently outperformed competitors by innovating battery technologies and ramping up production capabilities. Recent improvements in cost efficiency and scaling production have reinforced positive outlooks from traders. Key focus areas include Tesla's development of its 4680 battery production and advancements in energy generation/storage, further suggesting a long-term competitive edge.
The broader market appears supportive of Tesla's growth prospects, particularly with EV subsidies and green energy initiatives in major economic regions. Tesla's brand recognition and consistent product releases continue to draw consumer attention, while strategic efforts like the buildout of gigafactories globally are seen as favorable catalysts for sustained revenue expansion.
**Recent Performance:**
Over the last week, TSLA has displayed steady consolidation and formed a strong technical base approximately near $280. This stability follows a significant bullish rally earlier in the month, and the stock now appears poised for a continuation to test resistance levels. Technical indicators such as the Relative Strength Index (RSI) remain within neutral-to-positive territory, while moving averages support the potential for upward trajectory amidst firm buying support.
**Expert Analysis:**
Analysts broadly expect Tesla to capitalize further on its technological leadership in the automotive market. Hedge funds and institutional investors have shown significant interest in maintaining long positions on Tesla due to growth-driven profitability and aggressive expansion. Experts view Tesla's ability to scale its production and integrate advanced AI technologies into the manufacturing process as differentiating factors in the industry.
Tesla's Q3 production and delivery targets have received favorable feedback, aligning with expectations of robust growth narratives. If global macroeconomic pressures ease, Tesla could benefit further from optimistic market dynamics, broadening its appeal among investors.
**News Impact:**
Tesla's recent progress in scaling production at its factories and updates on the highly anticipated Cybertruck have sparked renewed confidence in the company's product lineup and potential market penetration. News regarding expansions into new territories coupled with strategic collaborations in energy storage solutions bodes well for long-term growth. Positive sentiment in this area tends to support the general bullish narrative among professional traders and market participants.
**Trading Recommendation:**
Tesla exhibits strong fundamentals and resilient technical qualities conducive to a long play this week. Professional trader consensus supports a bullish stance, further backed by favorable news impacts and sustained market demand for Tesla vehicles and innovations. Maintaining stops near broader support levels while aiming for gradual upward price targets is recommended to balance risk and reward. Consider this a solid long opportunity for near-term price advancements.

$TSLA Weekly RecapNASDAQ:TSLA Weekly Recap
Market Structure: Price broke out of the downtrend with a strong bullish engulfing candlestick, indicating a potential reversal.
Market Bias: A healthy retracement occurred in alignment with market sentiment — this pullback may be necessary to support a stronger move toward all-time highs.
BX-Trender: The weekly histogram flipped from red to green, suggesting increased accumulation and potential for upward momentum.

Wajani Investments: TSLA AnalysisDaily chart
Observations: TSLA has tested a key level turning resistance into support with a double bottom, head and shoulder as seen from the W formation. If you zoom the chart properly, you'd see TSLA direction is uptrend and the above indicators show TSLA moving higher.
Always adapt to the market as it changes. The analysis done here is more of a guidance than fact.
Let me know your thoughts.
Thank you.

Is a Tesla Stock Rebound Imminent?Tesla's stock has recently faced volatility, partly due to first-quarter 2025 delivery figures that did not meet some market expectations. Despite this, several significant factors suggest a potential for upward movement in the share price. As the stock hovers around $292 in late April 2025, market observers are closely watching for catalysts that could shift sentiment and drive value appreciation for the electric vehicle and energy company.
Key indicators pointing towards a potential rebound include notable insider activity and the highly anticipated launch of a dedicated robotaxi service. A Tesla board member and Airbnb co-founder recently purchased over $1 million in TSLA stock, marking the first insider buy of this magnitude in approximately five years. This action signals strong internal confidence. Furthermore, the planned June launch of a robotaxi service in Austin, Texas, using autonomous Model Y vehicles, is viewed as a transformative step that could open substantial new revenue streams and redefine Tesla's market position.
Adding to the bullish sentiment is unusual activity in the options market, where a significant investor placed a large bet on a substantial price increase in the near term through out-of-the-money call options. While recent delivery misses and concerns regarding external factors have contributed to past stock pressure, the combination of insider conviction, a looming disruptive service launch, and aggressive bullish options trading suggests that the market may be poised for a significant reaction to upcoming positive developments. Investors are keenly focused on the successful execution of the robotaxi strategy as a critical determinant of future stock performance.

Will be an epic year for TSLAThis dip was a great oportunity to get in into Tesla, as Elon will be focus more into it. I spect a rally to 0.618 fib level for the next week, and a 5 waves up to a new price discovery for the next couple years.

Telsa Bullish Recovery in Motion Tesla (TSLA) – Bullish Recovery in Motion
Chart Type: 2W (Biweekly)
Current Price: $292.03
Previous High: $488.54
Fibonacci Levels:
0.236 → $280.31
0.382 → $320.35
0.5 → $352.72
0.618 → $385.09
0.786 → $431.17
📈 Technical Breakdown:
Tesla has officially bounced from the major demand zone around $175–$215, forming a structural higher low.
We're currently testing the 0.236 Fib level after a clean bullish recovery. Volume appears steady, and if we hold above this level, we could see a move toward the $320–$352 region (Fib 0.382–0.5), which aligns with the upper structure zone.
The purple supply zone from the previous high near $488 marks a key resistance area long-term. However, price action suggests a possible mid-term continuation as long as this new support holds.
🧠 Trader’s Insight:
A lot of traders are only watching the daily and 4H charts. But when you zoom out to the biweekly (2W), the structure tells a very different story — one that still respects bullish continuation off a long-term retracement.
This recovery looks like a measured move, and we might see slow momentum upward before the market re-tests upper zones. I’m personally watching the $320.35–$385.09 levels for the next key decision.
📌 Tags
#TSLA #Tesla #NASDAQ #StockMarket #TechnicalAnalysis #FibLevels #BullishStructure #SwingTrading #LongTermInvesting #TradingView #MarketStructure #DemandZone #TeslaStock

TSLA – Approaching Key Resistance With Strong MomentumTSLA – Approaching Key Resistance With Strong Momentum, But Watch the Reaction at $292–$294
TSLA’s recent rally has been pretty clean. After breaking out of the falling trendline on the daily, price steadily pushed through lower highs and formed a nice higher low. Now, it’s testing a significant resistance zone between $292 and $294. That area capped the last few rallies—and we’re right back there again.
On the daily chart, the MACD is still climbing and has room to run, while the Stoch RSI is entering the overbought zone but not yet topping out. That tells me momentum is still present, but we’re approaching a decision point.
Flipping down to the 1-hour chart, price broke above the descending trendline and held higher support intraday. However, it’s currently rejecting slightly under $294. Volume didn’t really spike yet, so we haven’t seen a breakout confirmation. If we do clear this zone with strength, there’s a clean air pocket toward $300, which also lines up with a massive call wall and the highest GEX level on the options chart.
GEX & Options Flow Insights:
Options GEX shows heavy resistance at $300, with a sharp drop-off in gamma exposure beyond that. The $292–$294 zone is packed with 2nd and 3rd call walls, suggesting dealers are hedging hard around this level. If TSLA starts grinding above $294 and closes with momentum, we could trigger a dealer chase toward $300.
On the flip side, $275 is the HVL zone for this week’s expiration (05/02), and below that $270 sits as the third Put Wall. Any rejection from $292–$294 with a sharp drop under $285 could trigger a fade down to that zone.
Implied volatility has cooled slightly but remains relatively elevated (IVR 35.9, IVX avg 76.9). This favors credit spreads or defined-risk debit setups.
Trade Setups I’m Watching:
🟢 Bullish Scenario (Breakout Confirmation):
* Above $294 with volume → scalp toward $297.50–$300.
* Call Debit Spread: Buy 290C, Sell 300C (May 3 expiry).
* Stop loss for breakout: Close under $289.
🔴 Bearish Rejection Play (Fading the Top):
* Rejection from $292–$294 zone → scalp short back to $285 or VWAP support.
* Put Debit Spread: Buy 290P, Sell 275P.
* Stop loss: Close above $295.
TSLA is at a pressure point. If it clears $294 with volume, bulls might squeeze it toward $300. But if it stalls, the risk of a pullback toward $275–$280 grows fast. Be ready for a reaction play either way.

TESLA LONG- ACTIONBUY:
$260-$300
TAKE PROFIT:
$340-$350
Hold the position, don't make any changes until you see the results. Good luck!

Another leg up? TSLA loaded wedgeLooking like it’s consolidating. Looking for another leg up if we get momentum.
Entry is my green ray. We have robotaxi info from last ER, I think it’s ready to move again. Not FA! But let me know what you think!
