Stellar (XLM)We have seen from Stellar in the past that after a triangular pattern ended, an impulse uptrend wave started. Now, a similar pattern has ended, and it seems an impulse wave has started. Let's see if Stellar can reach high or not.
XLMUSD trade ideas

XLMUSD Buy the next pull back and target 0.11450Stellar / XLMUSD is having the strongest 1day candle since March 21st, which was the bullish break out candle half way of the uptrend leg that peaked at 0.1145 on April 1st.
That sequence pulled back first to the 1day MA50 before completing the end of March rally.
With the 1day RSI deep into the overbought zone, it is highly likely to see a repeat of this scenario.
Buy the next pull back and target 0.11450 (Resistance A).
Follow us, like the idea and leave a comment below!!

XLMUSD - Ascending triangle with first target .1169 and .199XLM has formed a ascending triangle and appears to be targeting the top of the range once more at .1169
A break above and successful retest of the top at .1169 will open a path for further movement to .199

XLM in clear accumulation zones with a possible upshot #XLM in clear accumulation zones with a possible upshot to prior retracements with BULLISH breakouts possible. This has little to do with XRP or #BTC; it's mainly about XLM being paired with #USDC on #COINBASE. I'm filling bags.

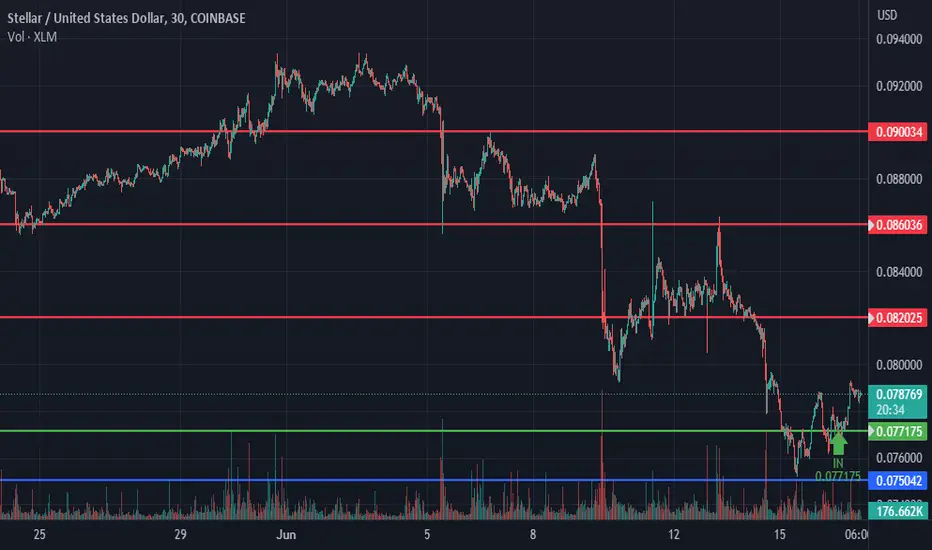

XLM 6/16/23 IN @I got in @ $0.077175
I will get out @ $0.082
measured move! 6.33%
lol smokey smokey :)


Reversal Potential on $XLM: Falling Wedge PatternHello, Traders! Today, I want to share an exciting technical analysis finding on the cryptocurrency Stellar Lumens ( LSE:XLM ). A falling wedge pattern has been identified, indicating the potential for a bullish reversal in the near future. Let's dive into the details!
📈 Ticker: LSE:XLM
📅 Timeframe: Daily Chart
📊 Pattern: Falling Wedge
📉 Understanding the Falling Wedge Pattern:
A falling wedge is a bullish chart pattern characterized by converging trendlines that slope downward. Typically formed during a downtrend, it suggests diminishing selling pressure and the potential for a reversal. This pattern indicates the possibility of an upward price movement.
🔍 Identifying the Falling Wedge on LSE:XLM :
Upon analyzing the daily chart of LSE:XLM , the following observations come to light:
1️⃣ Recent downtrend: LSE:XLM has experienced a decline in price over the past weeks.
2️⃣ Converging trendlines: The upper trendline connects the lower highs, while the lower trendline connects the lower lows.
3️⃣ Decreasing trading volume: As the falling wedge pattern forms, the trading volume has been declining, indicating a potential reduction in selling pressure.
📈 Price Targets and Trading Strategy:
If the falling wedge pattern on LSE:XLM plays out as anticipated, a potential bullish breakout above the upper trendline may occur, leading to a reversal and potential price appreciation. Consider the following price targets:
1️⃣ Target 1: Resistance level near $0.40
2️⃣ Target 2: Psychological resistance near $0.50
🛡️ Risk Management:
Managing risk is crucial for successful trading. Implement the following risk management techniques:
1️⃣ Set a stop-loss order below the lower trendline to protect against unexpected price movements.
2️⃣ Adjust position size based on your risk tolerance and overall portfolio management strategy.
🔔 Conclusion:
Keep a close eye on Stellar Lumens ( LSE:XLM ) as it develops this falling wedge pattern. The pattern suggests the potential for a bullish reversal on the horizon. However, please note that technical analysis is not infallible, and market conditions can change rapidly. Combine this analysis with other relevant factors before making any trading decisions.
Disclaimer: This post is for informational purposes only and should not be considered as financial advice. Always conduct your own research and consult with a qualified financial professional before making any investment decisions.
Happy Trading! 📈💰
#tradingview #technicalanalysis #fallingwedge #bullishreversal #xlm #cryptocurrency #chartpatterns #tradingstrategies #investing #finance #marketanalysis

AW - CRYPTO MARKET UPDATE - I Told You To Be Careful...Welcome to the AriasWave market update, where we dive deep into the world of Cryptos and the Dow Jones, providing you with valuable insights and thoughts.
Through my meticulous analysis, you'll quickly realize the weight and accuracy behind my predictions. Unlike anywhere else, you'll find unique and unparalleled analysis in my videos, unlike the poorly informed content from other providers.
By following my work, you'll not only save yourself from potential losses but also safeguard your capital. When the time is right and I give the green light, you'll be ready to make significant moves that can change your life.
Don't miss out on the upcoming life-changing events. Stay tuned and be prepared for what lies ahead.


XLMI mainly rely on historical data in my analyses. I have many visions, and I share them with you. In addition, I think that it is possible that XLM is a very promising coin, but sometimes I think that it requires too much time and effort to stand by it :) I wish you success and share my analysis with you.

6/10/23BEAR MODE! OVER SOLD! RED CANDLES & GREEN CANDLES!
4.20% move! lol
be careful catching knifes! lol

XLMHello, the price of Stellar in the weekly time frame with a medium-term view is suitable for investment.

Stellar XLM to $33. Loooong.1. Franklin Templeton
2. United nations refugees
3. Moneygram rails
4. Ukraine and other CBDC's
5. Elon Jed partnership to make X
Only if you gots the eyes to see.

XLMUSD (1H) - Bullish breakoutHi Traders
XLMUSD (1H Timeframe)
The market is in an uptrend, and we are waiting for an entry signal to go LONG above the 0.0917 resistance level. Only the downward break of 0.0895 would cancel the bullish scenario.
Trade details
Entry: 0.0917
Stop loss: 0.0895
Take profit 1: 0.0931
Take profit 2: 0.0953
Score: 8
Strategy: Bullish breakout

XLM 1D chart. Let me know what you thing ?Hello my Friends.
Let's take a look at my thinking which is that we should sit on support and see some nice run over the 14 days. I don't mean only now a coin like XLM, but many others.
What I like about this chart is the similarity of how the market behaves. Here we see that we are sitting on the range. I am currently slightly below the range and if we are able to get back into the range and consolidate, I would say this scenario is very likely.

XLM this fallthe BULL will be BACK!
XLM has around 120 days left of the BEAR! this fall around 9/23 the BULL will be back! :)
get your dry powder ready!

XLM - Stellar Lumens - Where's The Rally? There is none.Over the past few months, I've consistently stated that we're yet to witness a bottom in the XLM or broader crypto markets.
If my warnings went unheeded, you might have experienced some losses.
It's completely normal to feel exhausted by this ongoing bear market.
Indeed, the market has a knack for wearing down both traders and investors.
If you've been keeping up with my analysis, you would know that, based on the present downtrend, the bottom is likely a year away at least.
What's your next move from here?

XLM 5/13/23I am out! Getting ready for the big move DOWN! Get dry powder ready! Life changing opportunity coming! :)

XLM TO SAGITTARIUS AXLM TO SAGITTARIUS A
Today at 16:00 UTC
a halfmoon will
occur and the moon
will be 22 days old.
the moon will move
from Scorpio to Sagittarius


