XLM : Structure AnalysisXLM : Structure Analysis
XLM recently broke through a key level around 0.2675.
The breakout looks solid and could stay that way since bullish momentum is fading, and this pattern has occurred multiple times before.
With a brief pause likely as the market waits for the FOMC decision, there’s a s

XLMUSDT 1D AnalysisXLM ~ 1D Analysis
#XLM Buy on retesting this support block or buy after successfully breaking the resistance line on this pattern with a short term target of at least 10%+.

XLMUSDT – Weekly Chart Buy opportunityXLM is breaking out of a long descending channel on the weekly chart, showing the first signs of a trend reversal.
The SBS indicator flashed a Buy signal on this timeframe, adding strength to the setup.
Price is currently testing immediate resistance. A weekly close above this zone with substant

XLMUSDT 1D AnalysisXLM ~ 1D Analysis
#XLM Buy after successfully penetrating this resistant line with a short -term target of at least 10%+ from here.

XLM/USDT – 3D Long Signal Active 📅 April 29, 2025
The system triggered a long entry at the last 3D bar close.
Currently, the price remains around the same levels.
✅ System conditions for a long are fully met:
MLR > SMA > BB Center > PSAR
Price is trading above the 200 MA on the 3D timeframe.
⚠️ Caution:
On the 1D timeframe, pr

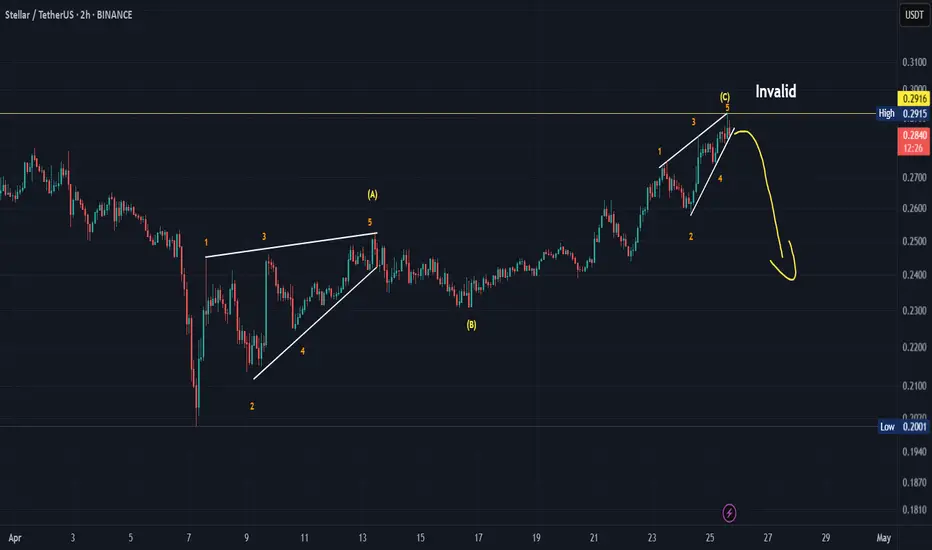
Coming down!I see three corrective waves in front of me that have been completed and concluded with an ending diagonal pattern. Please be careful of the possible upcoming decline.
*In principle, I am not a supporter of any direction, but I am only giving my point of view, which may be right or wrong. If the ana
XLM(Stellar) 115% Growth SoonStellar has been able to create one of its most significant historical lows with the right position.
By breaking the trend line, it has confirmed its bullish structure and can grow to 115%.

Can Stellar Break Free? Watch This $0.29 Resistance ZoneHello and greetings to all the crypto enthusiasts, ✌
All previous targets were nailed ✅! Now, let’s dive into a full analysis of the upcoming price potential for Stellar 🔍📈.
Stellar (XLM) is currently trading within a descending channel and approaching a key trendline.A breakout to the upside co

XLMUSDT Potential UpsidesHey Traders, in today's trading session we are monitoring XLMUSDT for a buying opportunity around 0.3000 zone, XLMUSDT is trading in an uptrend and currently is in a correction phase in which it is approaching the trend at 0.3000 support and resistance area.
Trade safe, Joe.

Bearish ScenarioI'm seeing a Bearish Harmonic Swan Pattern.. This will happen if BTC will take out the liquidity at 99.5k..

See all ideas
Summarizing what the indicators are suggesting.
Oscillators
Neutral
SellBuy
Strong sellStrong buy
Strong sellSellNeutralBuyStrong buy
Oscillators
Neutral
SellBuy
Strong sellStrong buy
Strong sellSellNeutralBuyStrong buy
Summary
Neutral
SellBuy
Strong sellStrong buy
Strong sellSellNeutralBuyStrong buy
Summary
Neutral
SellBuy
Strong sellStrong buy
Strong sellSellNeutralBuyStrong buy
Summary
Neutral
SellBuy
Strong sellStrong buy
Strong sellSellNeutralBuyStrong buy
Moving Averages
Neutral
SellBuy
Strong sellStrong buy
Strong sellSellNeutralBuyStrong buy
Moving Averages
Neutral
SellBuy
Strong sellStrong buy
Strong sellSellNeutralBuyStrong buy
Displays a symbol's price movements over previous years to identify recurring trends.