$XLM BREAKOUT ALERTCRYPTOCAP:XLM BREAKOUT ALERT 🚀
XLMUSDT just broke out of its multi-month descending channel on the 2D chart!
A clean close above resistance opens the door to a potential 150 %+ move toward the $0.77 zone 📈
The chart structure looks bullish, and momentum is picking up fast.
Watch for continuation 👀
DYRO, NFA
XLMUSDT.P trade ideas

XLMUSDT – Weekly Chart Buy opportunityXLM is breaking out of a long descending channel on the weekly chart, showing the first signs of a trend reversal.
The SBS indicator flashed a Buy signal on this timeframe, adding strength to the setup.
Price is currently testing immediate resistance. A weekly close above this zone with substantial volume could confirm the breakout.
If confirmed, the next targets are:
Target 1: ~$0.38
Target 2: ~$0.47
Still early, but looks promising if we see continuation above the red zone.
Watch for breakout + volume = solid entry.

Stellar (XLM) Falling Wedge + Inverse Head & ShouldersBINANCE:XLMUSDT has recently broken out of two major bullish patterns:
• Falling Wedge: The breakout above the descending resistance (orange) confirms the wedge setup, with a measured target around $0.70.
• Inverse Head & Shoulders: Breakout confirmed with a measured target around $0.40.
Key Levels to Watch
• $0.30 – 0.618 Fib level. IH&S neckline and current support. A break below it would invalidate the IH&S setup and potentially lead to a retest of the wedge's resistance as support.
• $0.36 – 0.5 Fib level and previous S/R.
• $0.40 – IH&S measured move target.
• $0.50 – 0.236 Fib level and previous resistance / swing high.
• $0.70 – Wedge measured move target.
Volume Analysis
Breakout volume is not as strong as expected, suggesting the need for further confirmation. A continuation with increasing volume would strengthen the bullish case.

XLMUSDT 1D AnalysisXLM ~ 1D Analysis
#XLM Buy on retesting this support block or buy after successfully breaking the resistance line on this pattern with a short term target of at least 10%+.

XLMUSDT Potential UpsidesHey Traders, in today's trading session we are monitoring XLMUSDT for a buying opportunity around 0.3000 zone, XLMUSDT is trading in an uptrend and currently is in a correction phase in which it is approaching the trend at 0.3000 support and resistance area.
Trade safe, Joe.

XLM longcopy paste XRP long strategy, range mid reclaim ichi f u bull signal, send it to range highs

XLM : Structure AnalysisXLM : Structure Analysis
XLM recently broke through a key level around 0.2675.
The breakout looks solid and could stay that way since bullish momentum is fading, and this pattern has occurred multiple times before.
With a brief pause likely as the market waits for the FOMC decision, there’s a strong chance that XLM could move lower, as indicated on the chart.
Key Target Levels:
0.2440
0.2260
0.2040
You may find more details in the chart!
Thank you and Good Luck!
❤️PS: Please support with a like or comment if you find this analysis useful for your trading day❤️

XLMUSDT 1D AnalysisXLM ~ 1D Analysis
#XLM Buy after successfully penetrating this resistant line with a short -term target of at least 10%+ from here.

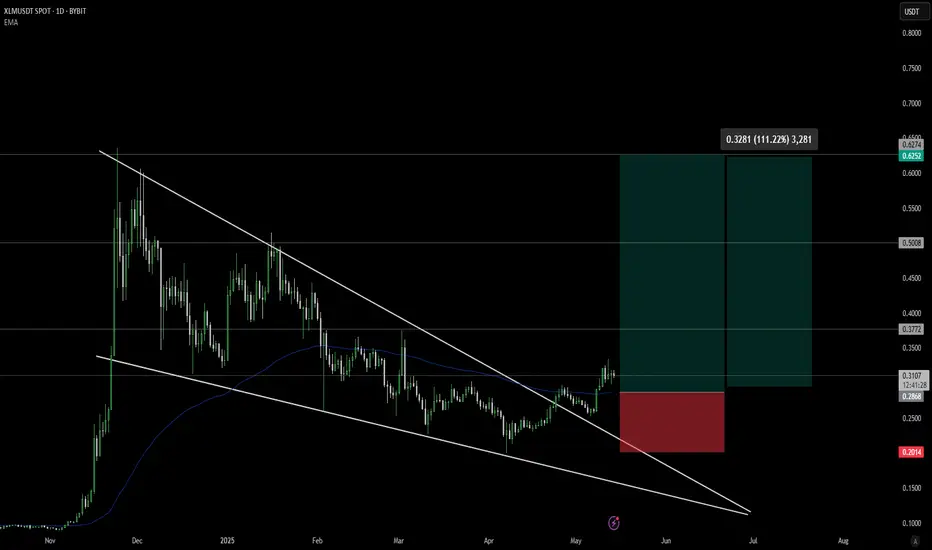
From Compression to Expansion: XLM Eyes 100% Move After BreakoutStellar Lumens BINANCE:XLMUSDT has emerged from a prolonged consolidation within a descending wedge pattern, delivering a potentially bullish breakout on the daily chart. This technical development could mark a significant turning point.
Technical Structure: The Descending Wedge
The descending wedge is a bullish reversal pattern that forms when the price action creates lower highs and lower lows within two converging trendlines. Since late 2024, XLM has traded within such a structure, slowly compressing in volatility as the apex of the wedge approached. This formation reflects a decline in bearish momentum and hints at an eventual upward resolution, precisely what occurred in early May 2025.
The breakout above the upper trendline of the wedge is a significant technical signal, suggesting a shift from distribution to accumulation. Breakouts from descending wedges often lead to sharp, directional moves as sidelined buyers regain confidence.
EMA Confluence and Confirmation:
Adding strength to this setup is the reclaim of the 100-day EMA, currently sitting around $0.2872. The EMA had acted as dynamic resistance during the wedge formation, with multiple failed breakout attempts earlier this year. The successful break and hold above this level now signal a potential trend reversal, reinforcing the bullish breakout.
The price is currently consolidating above the 100 EMA, creating a new base of support. If this level holds, it could serve as a launchpad for further upside movement in the days and weeks ahead.
Key Levels and Trade Context:
Immediate resistance lies at $0.3772, which aligns with previous structure highs and horizontal supply zones. Beyond this, higher resistance targets are marked at $0.5008 and $0.6252—each corresponding to major levels from prior cycles.
On the downside, the invalidation point sits clearly below the wedge and the EMA at $0.2014. This makes risk management straightforward for traders, with stops logically placed beneath this key level. The defined support zone gives the trade setup a favorable risk-to-reward profile, offering more than 2:1 reward relative to risk if targeting the first resistance alone.
Pattern Implications and Measured Move:
The measured move from a descending wedge is typically equal to the maximum height of the pattern, added to the breakout point. Based on this metric, a breakout from the $0.31 zone could yield a target close to or even above the $0.60 level, aligning with historical resistance.
This makes the potential upside around 100% or more from current levels, highlighting the value of participating in such early trend reversals when confirmed by multiple technical factors.
Educational Takeaway:
This setup provides an excellent educational case study for traders seeking to improve their pattern recognition skills. The descending wedge is one of the more reliable reversal patterns, especially when paired with additional confirmation such as EMA reclaim, strong volume surges, or bullish candlestick structure at the breakout point.
Understanding the importance of confirmation—rather than anticipation—can greatly improve trade outcomes. This chart also illustrates how structure, trend, and timing come together to create asymmetric opportunities in the crypto market.
Conclusion:
The breakout in XLM/USDT marks a decisive shift in market structure and momentum. The combination of descending wedge resolution, 100 EMA reclaim, and a clearly defined trade setup makes this chart technically attractive. Traders should monitor continuation patterns and volume closely to gauge the strength of the trend, while investors may consider this a signal that the longer-term bottom could be forming.
As market sentiment across altcoins improves, CRYPTOCAP:XLM 's current technical posture positions it as a prime candidate for outsized gains. Whether you're actively trading or looking for longer-term entries, XLM deserves a spot on your watchlist in the weeks ahead.
XLM/USDT – 3D Long Signal Active 📅 April 29, 2025
The system triggered a long entry at the last 3D bar close.
Currently, the price remains around the same levels.
✅ System conditions for a long are fully met:
MLR > SMA > BB Center > PSAR
Price is trading above the 200 MA on the 3D timeframe.
⚠️ Caution:
On the 1D timeframe, price is still below the 200 MA, which suggests some lingering weakness. Proceed carefully.
📍 Strategy Plan:
Consider entering long at today’s daily close or at the next 3D bar close.
Suggested stop-loss: below the latest PSAR dot for system integrity.
🔔 Keep an eye on updates and thank you for reading! 📈📊

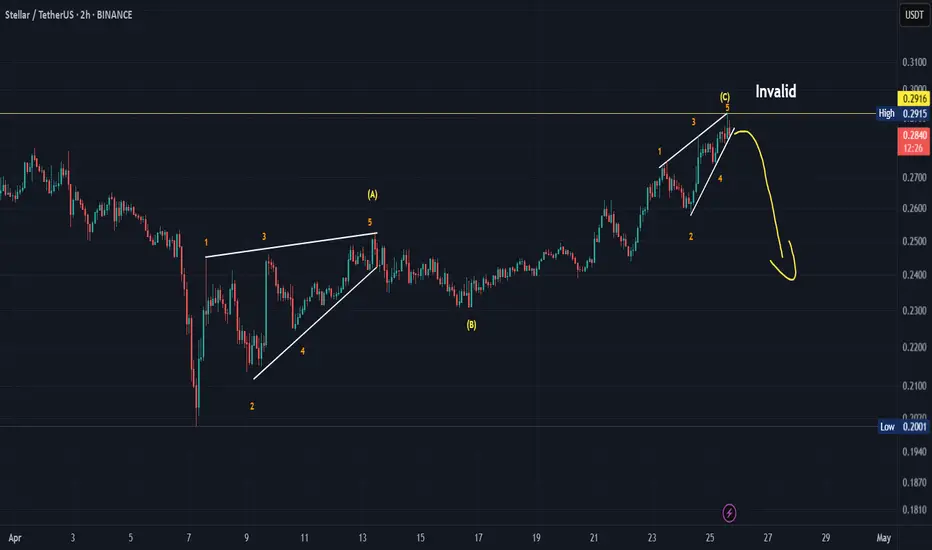
Coming down!I see three corrective waves in front of me that have been completed and concluded with an ending diagonal pattern. Please be careful of the possible upcoming decline.
*In principle, I am not a supporter of any direction, but I am only giving my point of view, which may be right or wrong. If the analysis helps you, then this is for you. If you do not like this analysis, there is no problem. Just ignore it. My goal is to spread the benefit. I am not one of the founders of the currency.
Bearish ScenarioI'm seeing a Bearish Harmonic Swan Pattern.. This will happen if BTC will take out the liquidity at 99.5k..

XLM(Stellar) 115% Growth SoonStellar has been able to create one of its most significant historical lows with the right position.
By breaking the trend line, it has confirmed its bullish structure and can grow to 115%.

XLMUSDTHello to all AMKT members, I hope you had a good day.😍
Today we are going to analyze the XLM coin.
On the weekly time frame, we entered a correction after the sharp rise that we were having, and now there are signs of the start of the next upward wave.
On the daily and 4-hour time frame, after the 0.3 break and the volume increase and the rsi enters the overbuy zone, we can take a long position.
For the short position, we can choose another token, but we can enter a short position with a break of 0.2601, but the trading risk is high.
I hope you have a good and profitable day.

Can Stellar Break Free? Watch This $0.29 Resistance ZoneHello and greetings to all the crypto enthusiasts, ✌
All previous targets were nailed ✅! Now, let’s dive into a full analysis of the upcoming price potential for Stellar 🔍📈.
Stellar (XLM) is currently trading within a descending channel and approaching a key trendline.A breakout to the upside could trigger at least an 18% move, targeting the $0.29 level. This target aligns with a major daily resistance zone and could act as a critical reaction point.📚🙌
🧨 Our team's main opinion is: 🧨
Stellar (XLM) is stuck in a downtrend but hovering near a strong trendline, and if it breaks out, we could see an 18% pump toward the key $0.29 resistance level. 🚀📊📚🎇
Give me some energy !!
✨We invest hours crafting valuable ideas, and your support means everything—feel free to ask questions in the comments! 😊💬
Cheers, Mad Whale. 🐋

XLM Wedge Broken
Stellar´s descending wedge (in green), which began last November, has been broken to the upside.
Next up is 0.31 resistance (gray zone). If this resistance breaks, a higher high will be made and we´ll be back in bullish mode.
The only caveat is the last of RSI divergence on the low, which statistically is more commonly present before a reversal.

XLM Approaching Key Moving Averages If the price of XLM breaks through all three moving averages cleanly, we could see one of those days where Stellar jumps up 50%+ in 24 hours.
I think given current market conditions something like this has an increased likelihood of occurring. Keep an eye of this one and wish me luck lol


Stellar (XLM): Huge CME Gap SpottedStellar still has that big CME gap that needs to be filled before we see another movement to upper zones
So far, after topping, the price has been falling steadily and we are looking for similar calm movement to happen and once we approach the CME, we are expecting some volatility candles to form there.
Swallow Academy

Is #XLM Setting Up for a Bull Trap Before a Major Drop?Yello, Paradisers! Is XLMUSD gearing up for a breakout, or is this just a classic liquidity grab before the next major dump? Let’s break it down.
💎Right now, #XLMUSDT is testing a minor resistance at $0.28464, a level where price has repeatedly struggled to push higher. While there is a possibility of a breakout, the presence of strong liquidity around the unmitigated supply zone at $0.31917 suggests that any move higher could be a trap before a significant drop. If price does manage to break above this resistance, traders should be cautious it’s likely just a liquidity grab before a larger move to the downside.
💎Once the price reaches the unmitigated supply zone, a rejection is expected, leading to a downward move toward the key support zone at $0.22699. This level has historically been a strong demand area where buyers could step in, potentially causing a temporary bounce or consolidation before any further downside.
💎As CRYPTOCAP:XLM moves lower, it’s crucial to watch volume activity. If the decline happens with high volume, it will confirm strong selling pressure and increase the likelihood of a deeper drop. However, if the price approaches $0.22699 with low volume, it could indicate a lack of seller conviction, leading to a short-term bounce before resuming the downtrend.
💎The EMA 200 continues to act as dynamic resistance, reinforcing the bearish outlook. As long as price fails to hold above $0.28464 or gets rejected from the supply zone, the bearish setup remains intact. In that case, a move toward $0.22699 and potentially even $0.19151 becomes highly probable. Watching volume reactions at these key levels will be essential to confirm the next move.
💎The only scenario that could invalidate this bearish setup is a strong close above $0.36172 with high volume. That would signal a potential shift in market structure and could indicate renewed bullish momentum.
Paradisers, patience and precision are key in this market. Let the levels guide you, trade strategically, and stay disciplined. Avoid emotional decisions this market punishes the impatient and rewards those who stay focused.
MyCryptoParadise
iFeel the success🌴

Xlm is going to fill Weekly FVGXlm is one the altcoins that will go far in mega altseason
but it needs more time to show its self
also consider that this is not financial advise this is my analysis about this chart

Could drop another 50%The weekly time frame shows that the price is walking in a corridor.
It reminds me of Aptos
Important level 0.2, if price will be more than 7-12 days below 0.2, targets 0.08 - 0.1

XLM Falling wedge? Looks like a textbook falling wedge. Market is slow but if sentiment changes XLM could do some things.
