XLM : Structure AnalysisXLM : Structure Analysis
XLM recently broke through a key level around 0.2675.
The breakout looks solid and could stay that way since bullish momentum is fading, and this pattern has occurred multiple times before.
With a brief pause likely as the market waits for the FOMC decision, there’s a s

XLMUSDT 1D AnalysisXLM ~ 1D Analysis
#XLM Buy after successfully penetrating this resistant line with a short -term target of at least 10%+ from here.

XLMUSDT 1D AnalysisXLM ~ 1D Analysis
#XLM Buy on retesting this support block or buy after successfully breaking the resistance line on this pattern with a short term target of at least 10%+.

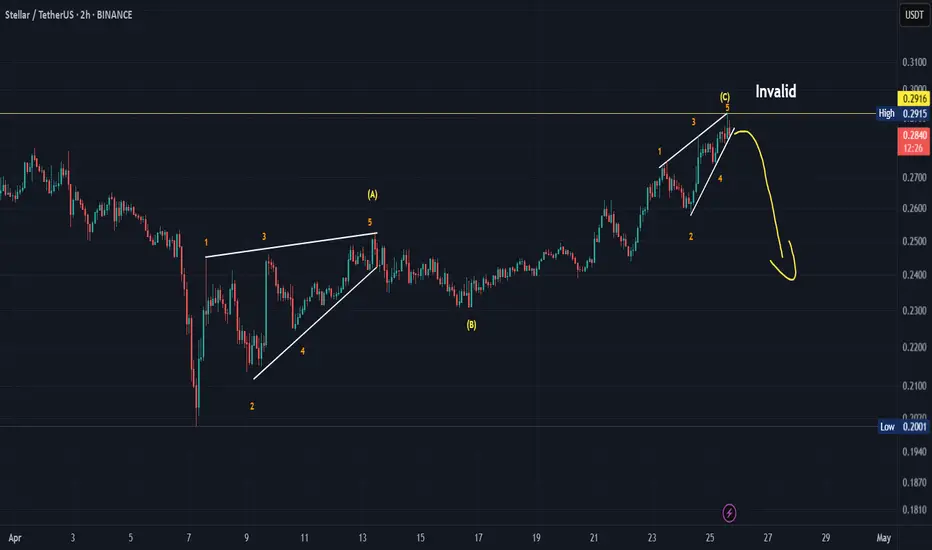
Coming down!I see three corrective waves in front of me that have been completed and concluded with an ending diagonal pattern. Please be careful of the possible upcoming decline.
*In principle, I am not a supporter of any direction, but I am only giving my point of view, which may be right or wrong. If the ana
Can Stellar Break Free? Watch This $0.29 Resistance ZoneHello and greetings to all the crypto enthusiasts, ✌
All previous targets were nailed ✅! Now, let’s dive into a full analysis of the upcoming price potential for Stellar 🔍📈.
Stellar (XLM) is currently trading within a descending channel and approaching a key trendline.A breakout to the upside co

XLM(Stellar) 115% Growth SoonStellar has been able to create one of its most significant historical lows with the right position.
By breaking the trend line, it has confirmed its bullish structure and can grow to 115%.

XLM/USDT – 3D Long Signal Active 📅 April 29, 2025
The system triggered a long entry at the last 3D bar close.
Currently, the price remains around the same levels.
✅ System conditions for a long are fully met:
MLR > SMA > BB Center > PSAR
Price is trading above the 200 MA on the 3D timeframe.
⚠️ Caution:
On the 1D timeframe, pr

XLM Wedge Broken
Stellar´s descending wedge (in green), which began last November, has been broken to the upside.
Next up is 0.31 resistance (gray zone). If this resistance breaks, a higher high will be made and we´ll be back in bullish mode.
The only caveat is the last of RSI divergence on the low, which statis

XLM Approaching Key Moving Averages If the price of XLM breaks through all three moving averages cleanly, we could see one of those days where Stellar jumps up 50%+ in 24 hours.
I think given current market conditions something like this has an increased likelihood of occurring. Keep an eye of this one and wish me luck lol

Bearish ScenarioI'm seeing a Bearish Harmonic Swan Pattern.. This will happen if BTC will take out the liquidity at 99.5k..

See all ideas
Summarizing what the indicators are suggesting.
Oscillators
Neutral
SellBuy
Strong sellStrong buy
Strong sellSellNeutralBuyStrong buy
Oscillators
Neutral
SellBuy
Strong sellStrong buy
Strong sellSellNeutralBuyStrong buy
Summary
Neutral
SellBuy
Strong sellStrong buy
Strong sellSellNeutralBuyStrong buy
Summary
Neutral
SellBuy
Strong sellStrong buy
Strong sellSellNeutralBuyStrong buy
Summary
Neutral
SellBuy
Strong sellStrong buy
Strong sellSellNeutralBuyStrong buy
Moving Averages
Neutral
SellBuy
Strong sellStrong buy
Strong sellSellNeutralBuyStrong buy
Moving Averages
Neutral
SellBuy
Strong sellStrong buy
Strong sellSellNeutralBuyStrong buy
Displays a symbol's price movements over previous years to identify recurring trends.
Related pairs
Frequently Asked Questions
The current price of XLM / UST (XLM) is 0.29450000 USDT — it has risen 3.51% in the past 24 hours. Try placing this info into the context by checking out what coins are also gaining and losing at the moment and seeing XLM price chart.
XLM / UST price has fallen by −0.59% over the last week, its month performance shows a 14.52% increase, and as for the last year, XLM / UST has increased by 174.46%. See more dynamics on XLM price chart.
Keep track of coins' changes with our Crypto Coins Heatmap.
Keep track of coins' changes with our Crypto Coins Heatmap.
XLM / UST (XLM) reached its highest price on May 16, 2021 — it amounted to 0.79729000 USDT. Find more insights on the XLM price chart.
See the list of crypto gainers and choose what best fits your strategy.
See the list of crypto gainers and choose what best fits your strategy.
XLM / UST (XLM) reached the lowest price of 0.07022500 USDT on Dec 29, 2022. View more XLM / UST dynamics on the price chart.
See the list of crypto losers to find unexpected opportunities.
See the list of crypto losers to find unexpected opportunities.
The safest choice when buying XLM is to go to a well-known crypto exchange. Some of the popular names are Binance, Coinbase, Kraken. But you'll have to find a reliable broker and create an account first. You can trade XLM right from TradingView charts — just choose a broker and connect to your account.
Crypto markets are famous for their volatility, so one should study all the available stats before adding crypto assets to their portfolio. Very often it's technical analysis that comes in handy. We prepared technical ratings for XLM / UST (XLM): today its technical analysis shows the buy signal, and according to the 1 week rating XLM shows the buy signal. And you'd better dig deeper and study 1 month rating too — it's buy. Find inspiration in XLM / UST trading ideas and keep track of what's moving crypto markets with our crypto news feed.
XLM / UST (XLM) is just as reliable as any other crypto asset — this corner of the world market is highly volatile. Today, for instance, XLM / UST is estimated as 2.92% volatile. The only thing it means is that you must prepare and examine all available information before making a decision. And if you're not sure about XLM / UST, you can find more inspiration in our curated watchlists.
You can discuss XLM / UST (XLM) with other users in our public chats, Minds or in the comments to Ideas.