XMR USDT LONG SIGNAL---
📢 Signal Alert
🔹 Pair: XMR / USDT
📈Trade Type: Long
💰Entry Zone: 416.34 - 409.74
🎯 Take-Profit Targets (Partial Management):
▫️TP1 = 431.87
▫️TP2 = 448.96
▫️TP3 = 469.54
▫️TP4 = 486.63
🛑 Stop-Loss: 398.00
📊Timeframe: 15m
⚖️Risk/Reward Ratio: 3.75
📌Suggested Leverage: 5x - 10x
⚠️ Capital management is mandatory.
💬Please review the chart before entering the trade.
---
🧠 Technical Overview:
XMR is consolidating within a key support zone between 416.34 and 409.74.A successful hold above the psychological 400.00 level could trigger a significant bullish move toward the identified targets. The price structure suggests accumulation at current levels with potential for upward momentum.
The R/R ratio of 3.75 provides a favorable risk-reward setup, while the multiple take-profit levels allow for systematic profit-taking as the trade progresses.
---
⚙️ Trade Management Tips:
· Scale into position within the entry zone for better average entry
· Take partial profits at TP1 and move stop-loss to breakeven
· Trail stop-loss for remaining positions as price advances
· Consider taking profits incrementally at each target level
· Close position immediately if price breaks below 398.00 support
· Monitor volume confirmation for breakout signals
---
⚠️ Disclaimer:
This signal is for educational purposes only and not financial advice.
Always perform your own analysis and apply strict risk management.
---
Note: The entry zone has been formatted as a range based on your provided numbers (416.34 and 409.74).
Trade ideas

XMR – Privacy Coin Ready to Follow ZCASH Pump? (Cup & Handle)ZCASH ( CRYPTOCAP:ZEC ), another privacy-focused coin, recently made a strong bullish move.
Since Monero ( CRYPTOCAP:XMR ) belongs to the same privacy coin category, it has a high chance to follow the same bullish momentum as capital rotates within this sector.
🧠 Technical Analysis
Cup & Handle Structure:
A cup & handle pattern is forming, signaling a possible continuation move.
The handle is currently developing inside the Golden Pocket (0.5–0.618 retracement zone) — a key level for potential bounce and re-entry.
Key Levels:
🟩 Golden Pocket (Entry Zone): 437–430
🟦 Major Support: 402
🟥 Major Resistance: 520 (ATH)
🎯 Target: 543 (≈ +23.9%) (based on cup size)
Momentum (Stoch):
Stoch is oversold and beginning to cross upward , suggesting a short-term bullish reversal setup.
💬 Conclusion
With Stoch oversold , price sitting inside the Golden Pocket , and a Cup & Handle pattern forming, XMR shows a strong chance to follow ZCASH’s bullish breakout .
Watch for a bounce confirmation in the Golden pocket zone before entry.
Bias remains bullish as long as price holds above 401 USDT .

$XMR About to Rip? — Hold $420 and We Fly📊 XMR Price Update | Breakout Watch
Monero (XMR) is trading above minor resistance, showing early signs of renewed strength.
The key level to watch is $420 — a clean hold above this zone could signal the start of another leg up in the current move.
🔹 Key Levels:
Immediate Support: $420 – needs to hold for momentum continuation
Next Resistance Targets: $448 → $472 → $495
Invalidation: Drop back below $410 would weaken the setup
🔸 Outlook:
Momentum is shifting bullish as price consolidates above resistance. Sustained closes over $420 may invite breakout traders and trigger fresh buying interest.
If volume picks up, XMR could easily extend toward the $470–$490 zone in the next impulse.
🧭 Strategy:
Look for confirmation candles and volume expansion above $420 before adding exposure. Dips toward $420 may offer good re-entry opportunities as long as structure stays intact.
⚡ Suggested Catchy Titles:
“XMR Breaking Out — $420 Hold Could Ignite the Next Rally 🚀”
“Monero Waking Up: $420 Is the Key to the Next Leg Up”
“XMR Bulls Back in Control — Watch $420 for the Breakout!”

xmr short ?Divergences have started to appear.
A potential trade could be considered on the breakout of the current range, as long as the divergences remain valid and are not invalidated.
The first targets are around the 0.7 Fibonacci level, which currently coincides with the liquidity zone on Hyblock (see a screen added to chart)
And of course, if the asset continues to rise, the target levels will adjust accordingly.

TradeCityPro | XMRUSDT Institutional Money Flow Into Crypto👋 Welcome to TradeCityPro Channel!
Let’s move on to the analysis of Monero (XMR) — one of the main privacy coins in the crypto market. As you know, XMR transactions are completely private and untraceable, making it a key player in privacy-focused crypto infrastructure.
🌐 Overview of Bitcoin
Before we begin, note that we’ve moved Bitcoin’s analysis to a dedicated daily report for deeper insights into its trend structure, dominance, and market behavior:
📈 Technical Overview
On the daily timeframe, XMR has shown a strong uptrend, clearly indicating capital inflow into the chart a sign that investors are positioning ahead of potential broader market strength.
It’s important to note that institutional or private capital often starts entering the crypto market through coins like Monero, due to its privacy nature and relative stability compared to smaller altcoins.
The current structure is forming a parabolic trend, and each time price has touched this parabolic curve, we’ve seen sharp upward movements. As long as the price remains above this curve, the bullish structure stays intact.
However, if the parabolic support breaks, we may experience a temporary correction before continuation.
🎯 Key Trigger:
Spot Entry Trigger: On a confirmed breakout above $367, we can look for a long (buy) position, anticipating continuation of this parabolic rally.
📝 Final Thoughts
Stay calm, trade wisely, and let's capture the market's best opportunities!
This analysis reflects our opinions and is not financial advice.

$XMR (DAILY): LONG position from $374CRYPTOCAP:XMR long position from here, $374, low leverage, following the BREAKOUT I talked about for weeks and it finally seems to materialize.
INVERTED HEAD & Shoulders pattern is breaking out (breakout point: $360) targetting $479 and invalidation of the RISING WEDGE going on too at the same time.
Volume spikes, that previous HIDDEN BULLISH RSI divergence working its magic.
Today's DAILY candle close MUST be a strong one, if not, I might close the LONG manually.
IN now at $374, STOP LOSS below $325 after a few 4-hr closes in order to avoid flash-crash wicks down.
Slow leverage, this will have days or weeks of upside following the #Privacy coins mania. This #Monero accumulation has been long, since JUNE and there should be an explosive move next.
💙👽

XMRUSDTWe are buying Monero (XMR) at $370.5 using a stop-buy limit order:
Stop-loss: $363
Target: $406
Risk-to-reward ratio: 1:6

Monero (XMR) Elliot Wave WAVE 3Monero is currently in subwave 3 of wave 3. After completing the first wave and its correction, we had a perfect 1-2 setup, which was fully fulfilled. Now we are in wave 3. For some, it might appear as if wave 3 is failing or rejecting at the 0.618 level for a longer correction—but it’s not. Keep your eyes open.
This is a typical 3-4-3-4-3-4 setup, which is common for an extended and long wave 3. We can expect some significant moves in the coming days. Monero is also still a privacy coin, which generally doesn’t get pumped. Monero is what many call the “real Bitcoin.”

Monero (XMR) Shows Exceptional Strength Eyes Yearly High Monero’s price action continues to demonstrate remarkable bullish strength, maintaining a well-defined uptrend with consecutive higher highs and higher lows. The market structure remains firmly bullish, suggesting that momentum is building toward a test of the yearly high at $420.
This level marks a critical resistance zone, and a successful reclaim and close above $420 could trigger a bullish expansion, propelling Monero into new yearly highs. From a technical perspective, XMR stands out as one of the strongest performers in the market, supported by sustained demand and consistent structural integrity.
Key Points:
- Strong Uptrend: Consecutive higher highs and higher lows confirm bullish control.
- Target Level: The $420 yearly high is the next key resistance to test.
- Expansion Potential: A breakout above $420 could lead to new yearly highs.
Monero’s continued resilience against broader market corrections reinforces its strong technical outlook.
What to Expect:
As long as XMR maintains its higher low structure, expect a move toward $420 in the near term. A decisive reclaim and close above this level could ignite further upside expansion and reaffirm Monero’s leading bullish position among major altcoins.

MoneroTechnical Analysis
1. Market Structure
Strong uptrend with consecutive higher highs and higher lows
Key support: 130-160 (long-term accumulation zone)
2. Fibonacci Retracement
0.618 level (~240-270): Golden Ratio aligns with critical accumulation zone
Price showed strong reaction from this level before breakout
3. Cup and Handle Pattern
Cup: Formed from peak down to bottom ~90-110, then recovered with rounded base
Handle: Purple/pink zone 240-400 - short consolidation phase
Target: 700-1000

$XMR (DAILY): MANUAL STOP LOSS at $332.85OMXSTO:XMR has given me no choice but to excuse myself out of this LONG like a proper gentleman.
BEAR RSI divergence detected on the recent HIGH, which was a weak one, and that candle closed below the recent high.
Also, BEAR OBV divergence — that’s a DEADLY combo, so I have exited my half-stakes LONG ($339), but still loving the chart and going to hunt for a dip soon, most likely.
#monero has been brilliant during the recent slow collapse, outperforming most of the coins, so that position was solid — no regrets, tiny loss of 2% in terms of price action.
Potential GOLDEN POCKET dips soon around the 200 MA ($306).
Too early to say. My $360+ BREAKOUT entry strategy is SUSPENDED — it’s blood everywhere, #Tesla , #nvidia, and even commodities.
No time to LONG stuff... but I still love this technically unique set-up on the DAILY chart 💙👽

Monero’s Glow — While Markets SlowI’ve mentioned in my previous publications that Monero looks stronger than the overall market.
It feels like Bitcoin’s correction doesn’t affect it at all, even though I canceled my previous plan (despite the price not reaching my invalidation zone), because sometimes certain details on the chart raise doubts and make me reconsider my decisions. But that’s exactly how I manage my risks and avoid losses.
After reviewing my analysis again, it seems that Monero is heading toward 365.
I’m also still following my scenario marked by the orange line from one of my earlier publications on this coin.
❌ Plan invalidation level: marked on the chart with a red line at 342.90.
⚠️ Disclaimer:
This is not financial advice or a trading signal.
Always make your own decisions and never trade without a stop-loss.

XMR USDT LONG SIGNAL---
⚠️ Disclaimer:
This analysis reflects my personal opinion only and is not a financial advice or buy/sell signal.
Please analyze the chart carefully and apply strict risk management before entering any trade.
📢 Signal Alert
🔹 Pair: XMR / USDT
📈 Trade Type: Long
💰 Entry Zone: 331.83 – 327.57
🎯 Take-Profit Targets:
TP1 = 352.54
TP2 = 371.00
TP3 = 408.74
🛑 Stop-Loss: 317.30
📊 Timeframe: 1H
⚖️ Risk/Reward Ratio: 7.0
📌 Suggested Leverage: 3x–5x
🔄 After TP1 is reached, move Stop-Loss to Entry to secure profits.
---
🧠 Technical Analysis Explanation:
XMR is showing strong bullish momentum after a clean retest of the 327–330 support zone, which previously acted as a demand area with heavy buy orders.
The market structure continues to form higher highs and higher lows, signaling that the uptrend remains intact.
The 50 EMA is rising steeply and serving as dynamic support, while the RSI has bounced back above the 55–60 range, confirming sustained buyer control.
Volume analysis shows steady accumulation near the entry zone, suggesting institutional participation before the next breakout.
The entry zone (331.83–327.57) provides an optimal risk/reward setup for continuation toward the next major resistance levels at 352–371–408.
The stop-loss at 317.30 is well-protected below structural support and recent liquidity levels, minimizing the chance of early stop hunts.
⚙️ Trade Management Tip:
Wait for a bullish engulfing or strong 1H rejection candle near support before confirming entry.
Secure partial profits at TP1, move SL to entry, and trail profits as the price approaches higher targets.
-

Orange Path to Glory – Monero’s 420 StoryTwo possible routes are shown on the Monero chart, yet both tell one story — the road to 420.
❌The invalidation zone is highlighted in red at 318,74.
💭 From here, I’m expecting more likely a move down to 324-330 first, before we see Monero shining at 420. That’s the move along the orange arrow.
I’m expecting more of a downside first, only then a strong move upward. Let’s see what the chart will show us.
This is not financial advice — everyone should manage their own risks

In Silence It Grows — Monero KnowsWhy did no one notice my first post about Monero? 🤔
Even during the recent drops, it never fell below my invalidation zone — not even close! That shows Monero is holding much stronger than the market.
In my view, something is forming now that could lead to a serious pump. 🚀
🎯 Target 1: 364
🎯 Target 2: 420
🌕 Global Target: 500
❌ Invalidation Zone: moved up from 318.74 ➜ 329
⚠️ Disclaimer:
This is not a trading signal or financial advice.
Always make your own decisions based on your own analysis and risk management — and never trade without stop-losses.

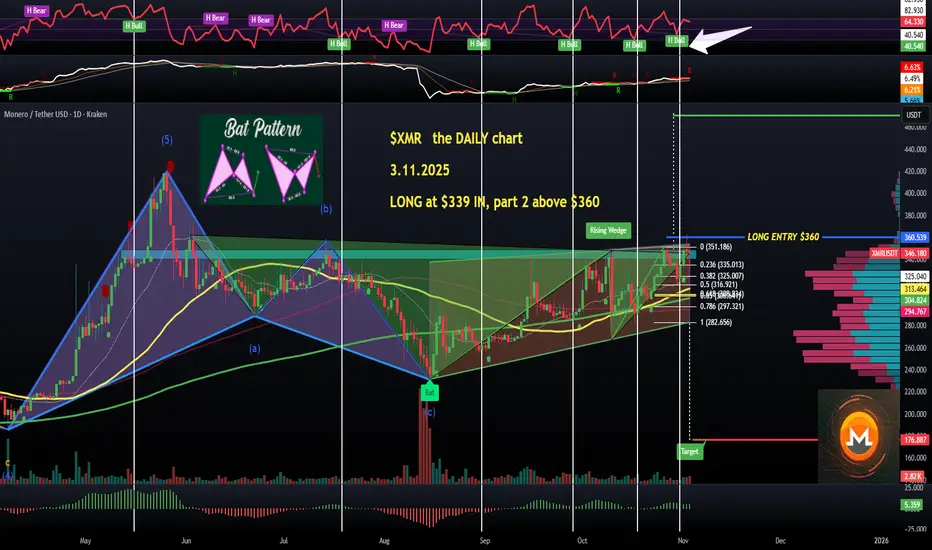
$XMR (DAILY): LONG position $339 in, more above $360I have loved CRYPTOCAP:XMR charts so much recently, and now they’re getting even more BULLISH despite the latest crypto sell-offs.
First of all, my favourite HIDDEN RSI divergences — I talk about them a lot for sure, but they tend to add to high-probability set-ups, by a lot, in my experience.
Have a look at the DAILY — out of the previous five cases, four led to immediate pumps, and #Monero has one of those active right now.
I had three ways to enter a long position in the quoted post published on Oct 28, one of them being buy-the-dip orders below $315 — that missed by literally $2 as the price dipped to fib 0.5 ($317), a perfect bounce that could signal a new ELLIOT WAVE structure (waves 1 + 2 done?).
Another strategy was to enter this old-school #PrivacyCoin after a retracement and rebound, so I did at $339, and that was a half-size trade. Another half will trigger as per my main strategy, which is a BREAKOUT ABOVE $355, entry around $360.
Horizontal lines on the chart show previous behaviour of price post-HIDDEN BULL RSI div’s.
They precede my best buy signals — and there have been plenty of these as well, also a rarity.
👽💙
XMR USDT LONG SIGNAL ---
📢 Signal Alert
🔹 Pair: XMR / USDT
📈 Trade Type: Long
💰 Entry Zone: 324.43
🎯 Take-Profit Targets:
TP1 = 330.55
TP2 = 337.90
TP3 = 347.00
🛑 Stop-Loss: 318.10
📊 Timeframe: 1H
⚖️ Risk/Reward Ratio: 3.6
📌 Suggested Leverage: 5x–10x
🔄 After TP1 is reached, move Stop-Loss to Entry to secure profits.
---
🧠 Technical Analysis Explanation
XMR shows strong bullish momentum after a clear retest of the 318–320 support zone, where buyers defended the price with high volume.
The market has formed a higher low structure, confirming continuation of the uptrend on the 1-hour timeframe.
The entry level at 324.43 aligns with a breakout retest above the EMA 50 and a minor resistance flip, providing a solid risk/reward setup.
The RSI has crossed above 50 and is trending upward, signaling renewed buyer strength.
Take-profit levels are placed at key resistance zones derived from Fibonacci extensions and historical reaction points.
The stop-loss at 318.10 sits safely below the last swing low to protect against volatility spikes or fake breakdowns.
---
⚙️ Trade Management Tip:
Wait for bullish confirmation candles (e.g., 1H engulfing or strong bounce) before entry.
Use partial profit-taking as each target is reached, and manage risk actively once TP1 hits by moving SL to entry.

$XMR (DAILY): LONG set-up, NEARLY thereCRYPTOCAP:XMR is by far my most favourite chart in the game right now — I can’t get enough of it. To the point where if you don’t love this chart, we cannot be friends, unfortunately.
Seriously, I can’t remember the last time I saw such a crazy combo of chart patterns with a clear, actionable BREAKOUT point as on the #Monero chart.
I’m waiting for this breakout above $355–360 like a hawk — the RSI has turned BULLISH and looks ready for the UPSIDE.
I didn’t mark it on this DAILY chart, but there’s a mini INVERSE HEAD & SHOULDERS pattern forming as well. Trigger orders await, alerts set, FINGERS CROSSED.
Much better situation than that of CRYPTOCAP:ZEC at the moment, just my 2 cents.
💙👽

$XMR (4-HR): my LONG set-upsMy strategy for CRYPTOCAP:XMR LONG remains the same as published last night. This time I'm zooming in on the 4-HOUR chart as there is more detail here, especially a valid ELLIOT'S WAVE count, which always makes set-ups more concrete.
Straight to the point, it looks like WAVE 3 upwards is finished, currently a corrective WAVE 4 that is projected to dip to $306 - $325, based on Fibonnacci retracement levels. #Monero usually corrects deeper than fib 0.382, so I would expect either $317 (fib 0.5, the most typical retracement level, supported by the green 200 MA at $315) or the GOLDEN POCKET retracement ($306 - $309, possibly a wick-action).
I like this set-up so much that I will try both strategies:
1) LIMIT buy order in THE GOLDEN POCKET (spot only)
... and, obviously:
2) the BREAKOUT entry strategy - cross above $360 with conviction, and it's a LONG.
WAVE 5 targets on the chart, in addition to the INVERSE Head&Shoulders TARGET on the DAILY.
HIDDEN BULLISH RSI divergence is forming again, which further convinces me that the BREAKOUT and a lot of upside could be inevitable.
💙👽
#PrivacyCoins
Much better set-up than #ZEC

$XMR (DAILY): BEAUTIFUL LONG set-upCRYPTOCAP:ZEC has been flying but not sure for how much longer, and I have got a much more interesting set-up in another privacy coin, OMXSTO:XMR MONERO.
Similar price, similar market-cap, but the smart move in my opinion is to LONG Monero above $360. This coin had fantastic time last MAY and JUNE, hit ATH at $421 (+125% in 7 weeks), the corrected for nearly THREE MONTHS.
BULLISH BAT reversal mid AUGUST and +50% since that bottom. So compared to ZEC, which has been in the last, parabolic phase of its ELLIOT'S growth cycle, MONERO has been in a range and is poised to attempt a BREAKOUT.
It's a DOUBLE BREAKOUT too, above a horizontal long-term RESISTANCE as well as above an INVERSE HEAD&SHOULDERS pattern (targetting $470).
A few ways to enter a LONG here:
1) trade the BREAKOUT (trigger position above $360). SL would be if the breakout fails, below $335. Or below $300 close, if SPOT.
2) wait for a BREAKOUT and ENTER on a retest, between $330 and $340.
3) position between $301 and $316 (200 MA and 50 MA, respectively, and these two key moving averages recently had a GOLDEN CROSS, always a bonus), as there could be a small correction before it breaks out. SL below the RISING WEDGE'S breakdown point, so below $255-260.
Absolutely intrigued by this chart to be honest, what a rare combination of chart patterns and confluences. Plus, a series of 3 HIDDEN BULLISH RSI divergences within the RISING WEDGE? Super rare, rising wedges tend to be accompanied by bearish divergences, not by the bullish ones.
#Monero is different, in a good way. And I love it for what it is, a privacy coin. Privacy is freedom.
This breakout will be amazing, my orders are ready.
👽💙

XMR Maintains Bullish Weekly Structure — Eyes $420Monero’s weekly chart continues to show a bullish structure, with price consistently forming higher lows — a clear indication of sustained upward momentum. This pattern reflects steady accumulation and growing confidence among buyers as the market gradually trends higher.
The continuation of this higher-low formation suggests that Monero remains structurally sound, with room for further upside movement. The key objective in the current phase lies at $424, the yearly high and a major resistance level that could determine the next directional impulse.
Key Points:
- Bullish Structure: Consecutive higher lows confirm ongoing strength on the weekly timeframe.
- Key Resistance: The $424 yearly high is the next major upside target.
- Breakout Potential: A breakout above $424 could extend the rally toward $518.
From a technical standpoint, Monero’s price action remains firmly supported by trend continuation dynamics. As long as higher lows persist, momentum favors the bulls, and buyers may continue defending short-term dips.
What to Expect:
A decisive break and weekly close above $424 would likely trigger a continuation rally toward $518. However, failure to breach this level could lead to temporary consolidation before another upward attempt.

Monero Gradual Grind Suggests Potential Vertical ExpansionMonero price action has shown notable resilience, steadily grinding upward toward $336. This slow-but-steady climb reflects controlled accumulation, often a precursor to vertical expansion when resistance liquidity thins out.
Key Technical Points:
- Resistance: $336 intermediate cap
- Support: $310–$315 short-term base
- Target: $380–$400 on breakout confirmation
If the current grind continues with low volatility and controlled pullbacks, XMR could be forming a vertical accumulation structure — a pattern that frequently precedes bullish acceleration. Sustained closes above $336 would confirm breakout behavior and expose higher targets.
However, losing momentum near this level or failing to hold the $310–$315 support would re-enter Monero into sideways consolidation.
Overall, Monero remains technically healthy, with structure and volume alignment favoring upside continuation if current resilience persists.

A look at the longs posted from today's list of potential longs A look at the longs posted from today's list of potential longs using PAR
