Palladium - CorrectionPalladium has confirmed a break of the uptrend line. To add to this signal, the top of this last move up coincides with the 161.80 fib extension level which could have been used as a profit taking level for longs.
A correction from here down to the 1615-1600 level (previous resistance zone) makes sense and this would be an ideal area to look for longs.
Shorting here is a risky option as it is a counter trend trade however previous corrections have been around 10-20% so a move down to the previous mentioned levels is a realistic scenario. Also there is an acceptable risk/reward ratio of approx. 1.4 if using the previous top as a stop loss level.
This analysis is for my own reference. This is not trading or financial advice.
Price Target 1615
ETA Early Dec
XPDUSD trade ideas

Is Palladium finally running out of steam?SHORT - XPDUSD
SL: 1811.95 (Suggested by our algorithmic system)
SL: 1832.00 (Safer option, personal suggestion)
TP: 1697.89
Reasons behind this idea:
1. Support trendline is subjectively broken.
2. MACD and Stochastic indicators have crossed down, bearish.
3. Minor RSI bearish divergence.
---------- Chart Drawings ----------
Blue Dotted Line: Broken Support Trendline (New Resistance Trendline)
Blue Solid Line: Next Supporting Trendline
Red Solid Line: Previous Resistance Trendline
Purple Line: Stoploss suggestion from our algorithmic system
Green Line: Take Profit suggestion from our algorithmic system
Red Arrow: Bearish Divergence
Screenshot of our mobile app alert: ibb.co (Timestamps are Australian Sydney Time UTC+7)
Please trade responsibly and good luck!


XPDUSD Intraday 6000pip sell signalAll indicators are co-centric and negative. All 4 averages cross below price in succession from shortest-term to longest term, indicating a high volume (large momentum) uninterrupted sale transaction;
The time frame of the event implies either news or selloff/take profit action rather than slow in industry demand.

Short-Term XPDUSD View1hr XPDUSD
Seeing the response of XPDUSD when passing through crosshairs.
Determine whether behavior indicates or predicts volatility
-50 cross below -200 has shown 14000pip fall within 3 days.

4hr XPDUSD response to VWMA -1
Seeing the response of XPDUSD when passing through crosshairs.
Behavior during high volatility.
-50 cross below -200 indicate 14000pip fall within 3 days.

Wk XPDUSD response to VWMA -1
Seeing the response of XPDUSD when passing through crosshairs.
Behavior during high volatility.


PALLADIUM : daily divergenceValidated daily divergence on TVC:PALLADIUM .
SL : 1835 (above weekly R1)
TP : 1620 (50% fibonnacci, and previous top)
RR : 2.3

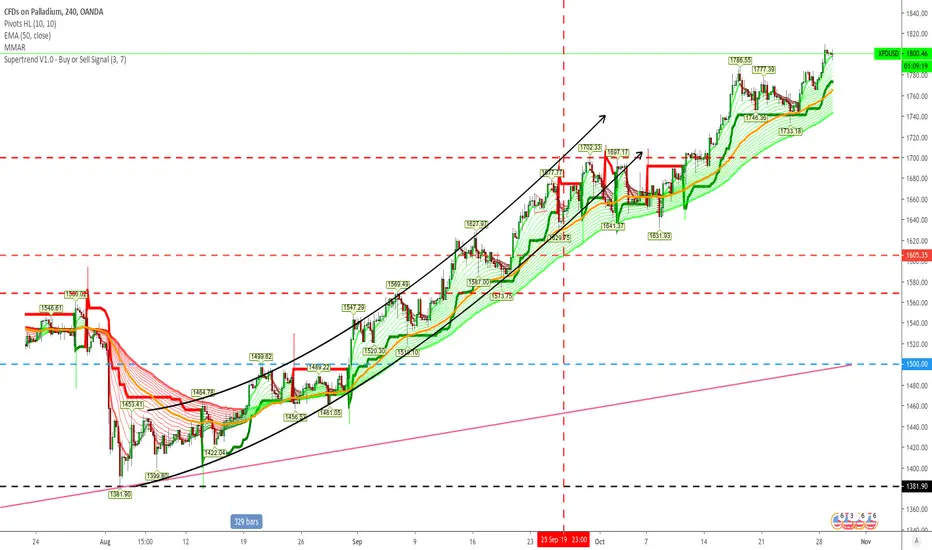
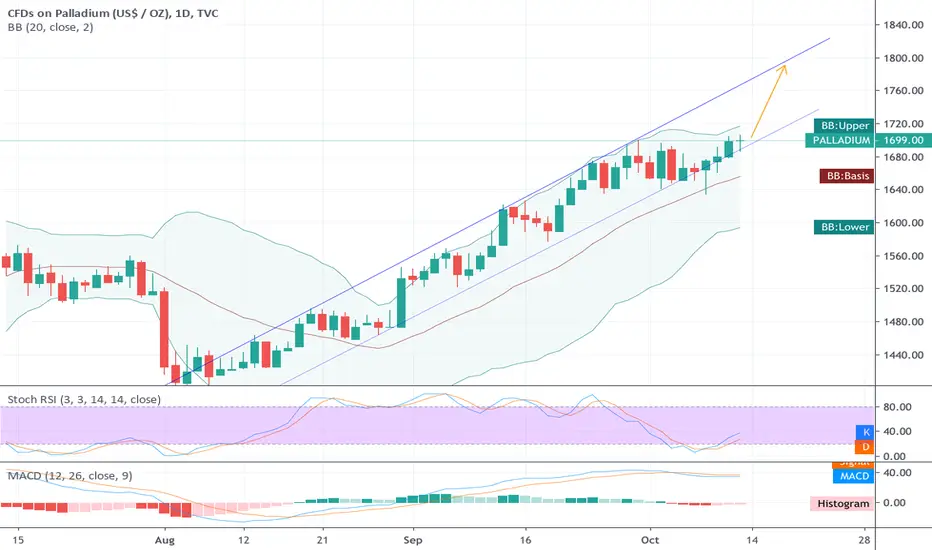
XPDUSD - SHORTPalladium has continued to rise over the last few months. Is it time for a correction? Break above previous high would invalidate, hold below could see a well earned retracement.

Week 45: Trade 2 - PalladiumA bit of speculation but Palladium is still bullish and going strong. Metals are being moving strong in uncertain times as well as Palldiums impact on auto industry wont slow down this year.
TP 1 -1850
T P2 - 1900
TP 3 - 2025

Short PalladiumI have nothing much to say in these kinds of graphs
With auto industry falling, global economic slowdown (its exaggerated but it is happening for sure), and consumer spending and industrial manufacturing falling, I think palladium might be getting exhausted with this rise.
Palladium is used mainly in 4/3 way catalytic converters along with rhodium.
Yes they are rare metals and found mostly in russia and south africa, but with auto demand falling, i dont see a reason why the demand should not fall
Technical indicator - Overbought
Short palladium 1780
Tp1 1750
Tp2 1710

PALLADIUM Continue the long Channel NEW ATHPALLADIUM Continue the long Channel go to the 161.8% of fibonacci
Join us : discord.gg

perfect continuationAs predicted palladium is making new highs and thrashing records. he cupd and handle is way too obvious and this shows its power.
Will be looking at least 2000 in the midterm. Look for a parabolic move that will send this metal sky high. It will determine the end of this rally. Sell ANY parabolic move from here.


week 42 - Trade 5: PalladiumStil on uptrend
dancing on uptrend lowline.
entry 1690
tp1 1750
tp2 1800

Palladium Over Priced !Hi there;
I try to see precious metals through different lenses, happy for you joining me and see things differently.
The above chart is the Palladium / Platinum Ratio, it shows how Palladium is expensive, and how Platinum is cheap.
The Palladium / Platinum Ratio rose from 0.2 to 1.7 today.
Buy Platinum, it's very cheap.
Avoid Palladium for now, it's very expensive.

Palladium Down !Hi everyone;
Did you see Palladium monthly chart?
Palladium price is forming a rising wedge.
Till now, five subwaves were counted, I expect additional two subwaves to come before the wedge complete.
Why?
It's a natural behavior to corrective waves to unfold in seven subwaves.
Also look at PPO Indicator ( Percentage Price Oscillator), it forms a contracted triangle with lower highs and higher lows, this indicates that as soon as the triangle break, the next move will be strong.
As soon as the rising wedge complete, Palladium Price will decline.
This is not a good time to buy Palladium.
