Juicy 0.93 incoming!I tried to tell you all :) Enjoy that juicy drop!
0.93 is inevitable :) Like Thanos, it’s coming!
XRPUSD.P trade ideas

Possible Distribution Scheme in XRP (Chaotic Scenario)Someone asked me what the most chaotic scenario for XRP's price could be — and I answered: a long-term Distribution phase.
In this image, I illustrate a radical distribution scheme that could potentially extend into late 2025. But first, a sign of weakness — with price dropping below the Corona Dump levels, possibly close to $0.10. Sounds absurd to many, I know.
If it's Scheme 1, XRP would drop and then bounce back to the Last Point of Supply (yellow line).
If it's Scheme 2 (red line), price could spike between $5 to $6.8, with an average peak around $5.5–$5.7, likely triggering extreme euphoria.
But remember, this is just one insane possibility — and it depends heavily on Bitcoin, Market Makers, Supply vs Demand, public interest, and the macroeconomic context.
If this scenario plays out… what would YOU do?

XRP Weekly ChartJust going down at this point, see if it retraces this clean range below or holds up and continues to range / move up.
Things should pick up again when Russia and Ukraine pack it in, even with Trump advocating its just gone down since Jan 20.

XRPUSD – Ready for the Next Move?XRPUSD – Compression Before Expansion?
After a strong rally from late 2024 that peaked near $3.40, XRPUSD has been in a gradual downtrend with a current price around $2.08.
Over the past few weeks, price has entered a sideways consolidation zone between $1.95 and $2.20, showing signs of indecision and low volatility. This structure often precedes explosive moves.
📌 Key Levels to Watch:
Support Zone: $1.90 – $1.95
Resistance Zone: $2.20 – $2.25
Breakout Target: $2.50 – $2.70 (if resistance breaks)
Breakdown Target: $1.75 – $1.60 (if support fails)
🔍 Market Outlook
The overall market structure remains bearish, but signs of a potential short-term reversal or relief bounce are forming.
A breakout or breakdown from this tight range will likely determine XRP's direction for the rest of the month.
Traders should monitor these levels closely, as a decisive move is likely within the next 5–10 days.
Disclaimer: This analysis is for educational purposes only and does not constitute financial advice.

xrp head and shoulderXRP has formed a Head and shoulder on the daily and 15 min chart it has already broken down through the neck line. I will be looking for the next resistance around 2.06 a break of that will take us to 1.98 and a buy zone. IMO below that will be a discount and will look for 1.70 to 1.50 to load more

XRP Weekly-Monthly Analysis / Retracement Levels for BuyTHEN - NOW@ XRP Weekly-Monthly Analysis / Retracement Levels for Buy (...and we keep going)
Weekly - Monthly trend: Bearish
Chart Pattern: Head & Shoulders (H&S) - Bearish Continuation Pattern
Bearish Candlesticks signals:
HANGING MAN (Bearish, Single Candlestick pattern) / Weekly Timeframe / 09 DEC 2024
BEARISH ENGULFING (Bearish, Double Candlestick pattern)/ weekly Timeframe / 27 JAN 2025
TWEEZER TOP (Bearish, Double Candlestick pattern) / 1 Day timeframe / 20 FEB 2025
FALLING THREE METHODS (Bearish, five-fold Candlestick pattern) / 1 Day timeframe / 07 MAR 2025
BEARISH ENGULFING (Bearish, Double Candlestick pattern)/ weekly Timeframe / 24 MARCH 2025
Retracement Fib Price Levels:
0.00% (3.4000)
23.60% (2.6879)
38.20% (2.2474)
50.00% (1.8914)
61.80% (1.5353)
78.60% (1.0284)
100.00% (0.3827)
Good prices for buy (the lower the better):
61.80% (1.5353) – Golden Zone / Golden Pocket
78.60% (1.0284) – Entry Zone
Between 78.60% (1.0284) and 100.00% (0.3827) is the Risk Zone, which we have the Neckline of the ‘’ Quadruple Bottom Pattern ‘’ at the price range ‘’ 0.6291 – 0.7850 ‘’

XRPUSD - ANALYSIS👀 Observation:
Hello, everyone! Based on what I see on the XRP (Ripple) chart, if we close above the price of 1.96695 on the weekly timeframe, I expect the start of a bull market towards the upside with a target of 4.00.
However, if the weekly candle closes below 1.96695, I anticipate a bearish move for Ripple, targeting 0.94799.
📉 Key Levels to Watch:
Support: 0.94799
Resistance: 4.00
Weekly closing price above 1.96695 will indicate a bullish trend.
💡 Expectation:
Bullish Scenario: Price closes above 1.96695 on the weekly, targeting 4.00.
Bearish Scenario: Price closes below 1.96695, targeting 0.94799.
💬 What’s your outlook on XRP this week? Let me know your thoughts in the comments!
Trade safe

buying ?@Ripple is in a complex corrective zone. Limited buying. A downward trend is expected, targeting $1.50.

XRP/USDT Chart Breakdown !XRP/USDT Chart Breakdown:
This chart shows a strong bullish setup forming after a clean liquidity swipe. Price dipped below previous lows into a known support zone and reacted sharply—classic smart money play.
Here’s the sequence playing out:
Triple bottom at strong support: Each dip into the ~$2.00 area has been aggressively bought up. That’s a strong sign of accumulation.
Liquidity swipe ("Swipe Liq / Adding more"): Price wicked below prior lows, likely to trap sellers and collect liquidity. The fact that it bounced immediately after shows buyer interest.
Previous resistance at $2.48 is the first key challenge. That level rejected twice already. If XRP breaks and holds above $2.48, that’s your green light for further upside.
Next levels to watch after $2.48 are $3.00 and $3.40+. These are psychological + technical targets based on previous price reactions.
The pattern in play is a “Bearish In → Bullish Out” structure. If price reclaims structure cleanly and volume supports the move, this can turn into a strong breakout run.
Invalidation is if XRP closes below ~$1.79. That would break structure and confirm sellers are in control again.
Final Thoughts:
This is shaping up as a buy-the-dip strategy with high reward potential. You’ve got support holding multiple times, a clear resistance to flip, and two strong upside targets.
It’s a matter of patience now. Watch for the breakout above $2.48 with strong momentum. If that happens, the bullish continuation to $3 and beyond becomes much more likely.
Want me to do a multi-timeframe confirmation or add indicators like RSI/VWAP/EMA on top of this?

INVERTED HEAD & SHOULDERS ON 4HR TFSupport and resistance trap the market, forming a left shoulder, then breaking out of the support zone, forming an inverted head. The market now breaks back into the zone; wait for a retest and buy to the resistance. If the market breaks back out of support and closes, wait for a retest and sell at the support area. Collect your losses and look for the next setup.

XRP - Bearish Gartley Pattern (Long & Short Positions)Confirmation:
Market Structure: The chart highlights a first weekly lower high and first weekly lower low, reinforcing a bearish trend.
Daily Fair Value Gap (FVG): Could serve as an additional target for the price.
Risk-to-Reward Ratio (RRR): The trade appears to have a favourable RRR, with an optimal entry around D.
1. Long Position (Counter-Trend Trade from C to D)
Trade Setup:
Entry: At point C, around the 0.882 Fibonacci retracement level.
Stop Loss: Below point A, ensuring protection against further downside.
Take Profit:
TP1: 38.2% retracement of the C-D leg.
TP2: 61.8% retracement of the C-D leg.
TP3: Full extension to point D (0.786 - 0.886 Fibonacci level).
Confluences for the Long Position:
✔ Bullish reaction at 0.882 retracement (potential demand zone).
✔ Daily Fair Value Gap (FVG) below adds liquidity, possibly supporting the price.
✔ Favorable risk-to-reward ratio (RRR).
2. Short Position (Bearish Reversal from D)
Trade Setup:
Entry: Around point D (between 0.786 - 0.886 Fibonacci retracement level).
Stop Loss: Above point X (invalidates the bearish Gartley setup).
Take Profit:
TP1: 61.8% retracement of the D-C leg.
TP2: B-point level.
TP3: Full retracement back to A (major structure level).
Confluences for the Short Position:
✔ Bearish Gartley completion at D.
✔ Key Fibonacci confluence at 0.786 - 0.886 retracement.
✔ Market structure suggests a lower high in a downtrend (weekly bearish trend continuation).
Pattern Type: Bearish Gartley
Key Levels:
X to A: Initial impulse move
A to B: Retracement to 61.8% Fibonacci level
B to C: Retraces deeper, around 88.2% Fibonacci level
C to D: Final leg completing at the 78.6% to 88.6% Fibonacci level

INVERTED HEAD & SHOULDERS ON THE 4HR TFSUPPORT & RESISTANCE are the black boxes. As you can see, consolidation forms the left shoulder, and the breakout of the support forms the inverted head; now, the market has broken back into the zone. Wait for the retest, and Take Profit will be at the resistance.

XRP Made a New Lower Low: What's NextFenzoFx—XRP (Ripple) trades at approximately $2.089 and made a new lower low in yesterday's trading session. The primary trend is bearish, as the price is below the 50-period simple moving average.
If the price holds below the immediate resistance at $2.218, the next bearish target could be testing the $1.80 support area.
Conversely, the bearish outlook should be invalidated if XRP/USD exceeds $2.218 and forms a new higher high.

KEEP TRADING SIMPLE - XRPGood Morning,
We did it - we formed a new support below. Currently a great trend upward on the daily but still unconfirmed. If today we get another bullish day - which we will this should confirm a great opportunity for a swing trade.
I will be looking at entering a trade once I se a retest of the support on the HOURLY chart.
Thanks

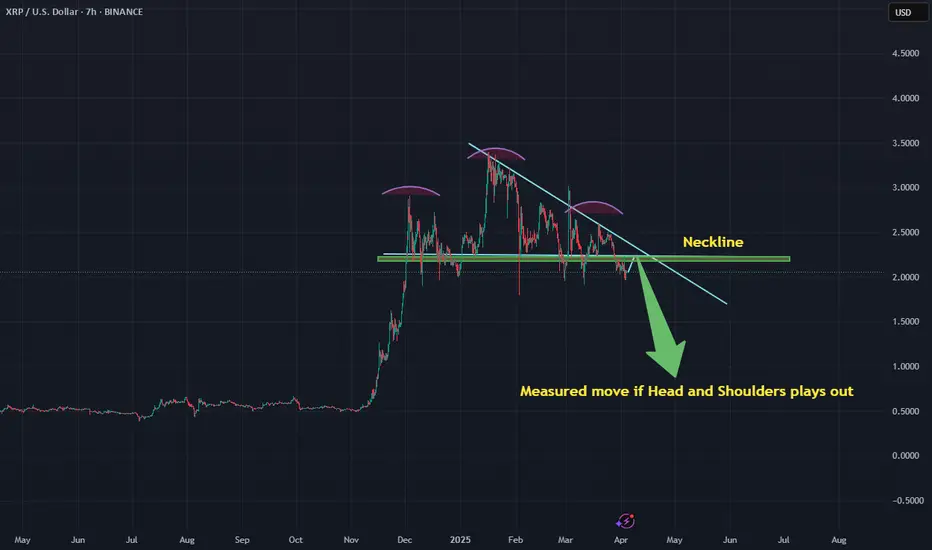
Is the news hyping the coin in order dump it ?! We could see a massive sell off in the incoming weeks if the H&S patterns works out. If goes at the text book says the target on this could be at 0.65.

XRP in Monthly chart.Hello
Please take time and read my idea.
I want to discuss about XRP.
As you know there are many controversial topics about this coin but for me as a chartist, what is important is its waves and movements.
What I see is a long-term correction that might be a triangle which happens in a time-consuming situations. Another considerable point is the sub-waves of this correction (probably a triangle) which are mostly WXY waves and you that this type of correction is time-consuming. The last but not the least, I can see releasing MACD and RSI peaks in this rage that might have a significant signal for us.
Overall, I think this symbol is collecting enough liquidity for a huge jump.
The alternative scenario is the break out of lower boundary and recored lower lowers that must not change our strategy to invest in this brilliant symbol. If it happen we will discuss about the best entry level then.
Thanks

Look at this beautiful short! 0.93We will hit 0.93
I told you guys over and over! I am making absolute BANK!!! LOL it’s so nice to be right :)
See you all at the bottom!! 0.93 is coming soon!

PAY ATTENTION! Price action incoming!!!Large Head and Shoulders on XRP
With so much volatility in the markets
right now...I would watch for a buying
opportunity around .89 cents. These
large Head and Shoulders can also be
invalidated should be break back above
the downward resistance line. Stay calm...
not saying this is a shoe in deal...just stay
alert for this price action. This would also
indicate BTC would make one more deep
dive down to 72500 before trending back
to the upside and resuming the bull run
till EOY. Good luck and keep your eyes open.
*********** HAPPY XRP HUNTING *************
XRP Bull Flag: The Calm Before the Crypto Storm?XRP is flashing a massive bull flag on the charts—a pattern that’s historically signaled explosive upward moves! After a strong rally (the flagpole), price is consolidating in a tight range (the flag), building tension for a potential breakout. Analysts are eyeing targets from $4.40 to as high as $15 or more if momentum kicks in. With regulatory clarity and growing adoption fueling the fire, could this be the setup for XRP’s next big run? Stay tuned!

XRP could be about to drop 20% XRP is under pressure as the global trade war escalates, with rising US tariffs fueling fears of inflation and recession. A break below 194.62 could trigger a major downside move, supported by a bearish technical setup.
This content is not directed to residents of the EU or UK. Any opinions, news, research, analyses, prices or other information contained on this website is provided as general market commentary and does not constitute investment advice. ThinkMarkets will not accept liability for any loss or damage including, without limitation, to any loss of profit which may arise directly or indirectly from use of or reliance on such information

$XRP Heading Lower?Hello hello to all my Tradeviewing fans & followers. Today I'm showing my CRYPTOCAP:XRP Daily chart with my price action prediction represented by the vertical dotted line which i laid out on 03/16/2025 and the green/blueish dotted arrow line showing my predicted movement, so far closely accurate and i will be expecting more downside sell pressure due to overall bearish market sentiment and a very low fear & greed index score of between 20 - 24 on the crypto and stock market. Tarriff news and uncertainty is definitely the cause for this panic.
Im expecting CRYPTOCAP:XRP to have a very likely bounce up to the $3.00 - 3.15 range ONLY IF CRYPTOCAP:BTC holds $78 - 74k support otherwise down we go to $1.06/1.04 area. I will updated as needed and more cryptos to come soon.
Thank you guys 😊

XRP/USD movement prediction.XRP going down to around $1.45 then up to around $2.16. Will c i can be wrong but market never wrong always correct

KEEP TRADING SIMPLE - XRPGood Morning,
Hope all is well. Market still reacting to the uncertainty of the news. Yesterday was very volatile and skipped back and forth throughout the day.
Currently XRP is looking for support, it is still bearish but is developing a bullish short term trend change.
I will keep you posted.
Thanks
