Is xrp going to break trend line Xrp's climb back up to the top of the trend lines if we could break trends and hold we're moving in the right direction
XRPUSD.P trade ideas

XRPXRP may be above $2.50 heading into May. With the approval of the Pro Shares ETF set to go Live on the 30th, we should see significant buying throughout the end of the month.
Any price action under $2.20 is all buying opportunity, moving forward we may never see $2 XRP again.

XRPU correction My vision where going price next wek.
Important area 2.350 if break it down price will fall to 2.250 and lower.

XRPJust a idea if we follow more of a 2017 bull market. Everything looks to be coming together..even the U.S and China Trade talk.

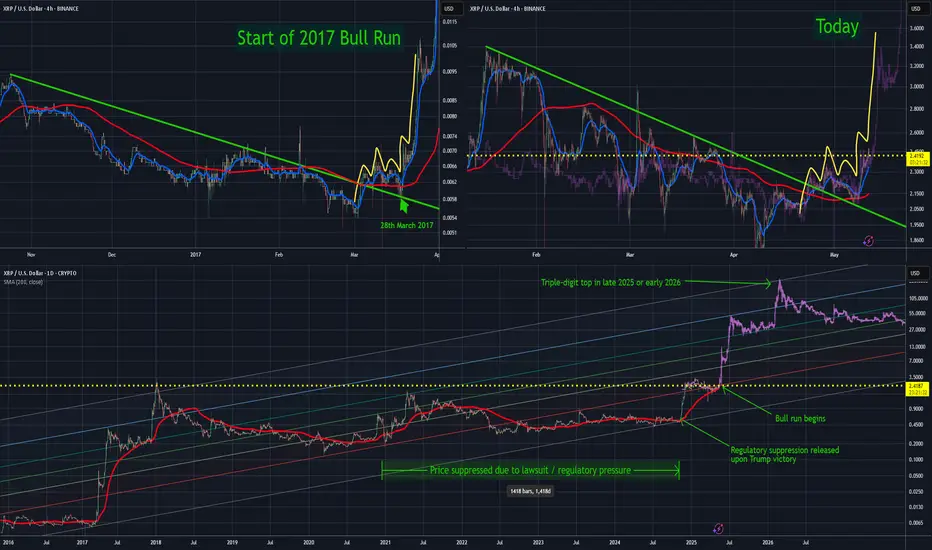
Thesis — How XRP Could Reach Triple Digits Within 12 MonthsAbout a month ago, I pointed out a pattern that preceded XRP’s explosive bull run in 2017. That same pattern is now playing out almost identically — and if the fractal continues to hold, XRP could be gearing up for another major move.
Frankly, the 4-hour chart is a near-mirror image of 2017’s setup. I’ve overlaid the original bar pattern onto today’s price action — the resemblance is hard to ignore.
If this plays out:
We could see a test of all-time highs within a week
Double-digit XRP by mid-year
Triple-digit XRP by late 2025 or early 2026
No guarantees, of course — but the structure is clear, and the setup is there.
For context, I view the November rally as XRP simply reverting to where it would have been had regulatory pressure not artificially suppressed the price. That move wasn’t the bull run — it was a reset.
Importantly, alt season still hasn’t kicked off (just look at BTC dominance), and XRP’s fundamentals are stronger than ever:
Lawsuit behind us
ETFs likely coming
Ongoing partnerships
Pro-crypto regulatory tone globally
Technically and fundamentally, XRP has never looked better.
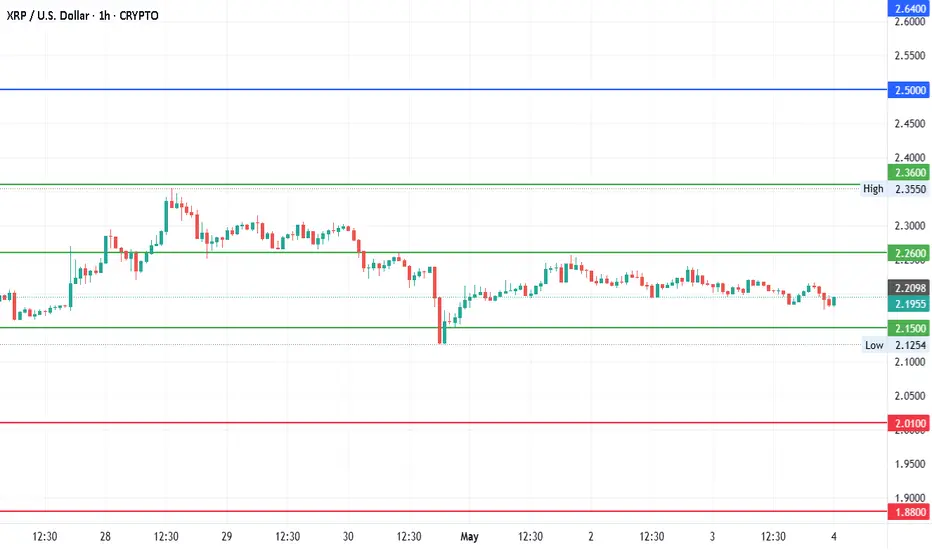
XRP Price Showing Support at Key LevelsXRP Price Action Update (Friday)
Chart Overview: We're analyzing the 1-hour chart. The orange lines represent weekly opens over the past few months, which have acted as support levels.
Support and Resistance: The price has consistently found support at key levels, currently holding around the $2.29 range. It's also above the weekly close target of $2.35-$2.36, aiming for the next target around $2.44.
Trend Reversal Potential: If the price can hold above the $2.44 level and move toward $2.59, it would indicate a trend reversal on the weekly chart, moving us out of the current downtrend.
Watch for Retracement: Expect a possible price retracement due to the large value gap. If there's no immediate retracement, it might happen over the weekend before continuing upward.
Break of Structure: The daily chart has shown a break of structure, which is a positive sign. Keep an eye on the key order block for further confirmation.

XRP Breaks Down from Rising Wedge – Is a Deeper Pullback Coming?XRP has officially broken down from a rising wedge pattern on the daily chart, closing below its lower trendline support. This could signal the beginning of a short-term bearish phase unless key support levels hold up.
Chart Breakdown
On the daily timeframe, XRP was trading within a rising wedge—a pattern typically considered bearish when it breaks to the downside. The breakdown came after price failed to reclaim the $2.30–$2.35 resistance zone, followed by a sharp move lower toward the $2.00 level.
Key technicals:
200-day EMA (blue line) is now acting as the first major support near $2.00
50-day EMA (purple) has turned into resistance
Price is hovering around $2.15, retesting the wedge from below
Bearish Price Targets
With the wedge breakdown confirmed, here are potential downside levels to watch:
$2.00 – Psychological level and strong dynamic support from the 200 EMA
$1.89 – Horizontal support from late March
$1.64–$1.61 – A critical support zone that marked the low before the last rally
If XRP fails to hold above $2.00 and closes below it, momentum could shift strongly in favor of the bears.
Bullish Scenario?
While the pattern suggests bearish momentum, bulls could still regain control if XRP closes back above $2.20 and re-enters the wedge. That would invalidate the breakdown and potentially open the door back toward $2.35 and higher.
Final Thoughts
The wedge breakdown is a warning sign for short-term traders. Unless XRP reclaims key levels quickly, it could be headed toward the $1.89–$1.64 support range. Keep an eye on volume and EMA support—these will likely determine if this is just a dip or the start of a larger correction.

XRP Long?After conducting a top down analysis, I will be looking to go long around the Daily Demand Zone of $1.50 - $1.30 zone but could potentially look for a better entry on the lower TF (5M-15M). In addition to this being a Daily Demand Zone, it also lines up with the Weekly Fib 61.8% level. TP 1 will be taken around the Daily Supply Zone (I will monitor closely) between $3.20 - $3.43. TP 2 will be $5.00.
I am looking for feedback in my analysis as I am new to trading. Any suggestions/tweaks appreciated.

XRP / USDCurrent Price:2.1950
Mid-range: Between 2.15 and 2.36
Upside: 2.50, 2.64, 2.78 and 2.92
Downside: 2.01, 1.88, 1.73 and 1.59
XRP. Kaput?*chart inverted*
Watching this trendline currently. XRP recently had a strong bounce off the 382 and we could see a further retracement to the 0.5 at roughly $2.80
Breaks of the trendline could trigger moves down 📉

XRP/USD Technical AnalysisFenzoFx—Ripple (XRP) remains in a bear market, though the downtrend slowed after dipping to $2.127. XRP is currently trading around $2.176, testing this level as resistance.
If XRP/USD breaks above $2.176, the next bullish target is $2.2200. Conversely, a drop below $2.127 could resume the downtrend, with $2.068 as the next support level.
>>> Prop Trading
>>> No Deposit Bonus
>>> %100 Deposit Bonus
>>> Forex Analysis Contest
All at FenzoFx Decentralized Forex Broker

XRP Would really like for XRP to hold the top of Thé channel.above 2.16 would be nice
Overall trend continues of weekend low volume so I rather see how we shake back tomorrow when the big boys show up.

XRPUSD is testing the Resistance level 2.3660 👉🏼 Possible scenario:
While much of the cryptocurrency market remained flat over the past 24 hours, XRP stood out as the top-performing large-cap altcoin. The token briefly dipped to $2.16 on April 27 before rallying to over $2.30, fueled by ETF-related developments. Although the news wasn’t the long-awaited spot ETF approval the community had hoped for, XRP still posted a 5% gain on the day, outperforming all top 25 altcoins.
The rally followed the U.S. approval of three Ripple-linked ETFs from ProShares: the 2x leveraged Ultra XRP ETF, the -2x Ultra Short XRP ETF, and the Short XRP ETF. These futures-based products, set to launch on April 30, reflect rising institutional interest in XRP, especially in the wake of Ripple’s recent legal victory over the SEC. Eyes are now on the SEC’s upcoming decision regarding Grayscale’s spot XRP ETF proposal, expected by May 22, which could serve as the next major market catalyst.
✅Support and Resistance Levels
Support level is now located at 2.1480
Now, the resistance level is located at 2.3660.


Ripple Elliott WaveTriangle
Break of the ascending trendline at the bottom of the triangle
Pullback
Price drop?
Ripple
No patience
No time

XRP break 2.24 bullish, is not, as low as $1.28Traders,
I have to make this quick I was bit by a brown recluse and put it off for a day or two longer than I should have. So I need to Skedaddle to the hospital super quick and fast!
Ok, here’s how I see it. I’m going to post this as a short to mid term trade but explain the long term possibilities. Considering this post is being done via my Moble rather than PC it just doesn’t make sense with my time and options.
so here’s what you’re gonna get the short term trade which I’ve labeled very clearly on the chart and the larger timeframe includes an Elliot wave analysis being that we clearly have a zigzagging consolidation wave that could do one of two things from here if we break about $2.24 we should be starting the next expansion wave. I will do an update if we do do that on this published trade to give an idea of where the price action could go but my immediate thoughts range from $9 to $27.
However, I want everybody to be cautious of a fake out as we are seemingly getting bullish on the weekend which I will be checking liquidity on all of the major alt coins and bitcoin before the weekend is over on our VIP live trading class that we do at 7 o’clock on Sunday night Eastern standard time. Yet, I will share my findings of the liquidity with everyone for this week only. As we definitely want to help as many newcomers and experience, traders, see manipulation, just in case it shows up before it plays out. There are many tools on trading view to find high buildup of large liquidity that the market makers could sweep down and take out if during this weekend we get really bullish And tons of money comes into the market from people’s tax returns, creating a pool of guppies that the market maker may just eat up one more time.
Which brings me to my thought of us potentially revisiting the .65 fib, the .618 or even all the way down to the .5 fib, which is at around $1.23. Nothing in trading is 100% so take my thoughts and stride. yet, I’ve been through three bull runs as a successful trader and market manipulation has been one of my main focuses purchasing mini subscriptions to different tools that give me information so we can take advantage of what the market maker does as opposed to be part of its liquidity grab.
For everyone reading this in the VIP group as you know normal time on Sunday, we will be having the recorded Zoom meeting, but I highly suggest that you make it because this is going one of two ways and there’s a big opportunity here to make some pretty serious pips in my opinion. If you’re not part of our group, I hope you use this information wisely in your research to come up with your decisions, but keep in mind, we are all just here for entertainment purposes! Following every single word from a trader online should never be your gospel to put tons of your money into the market in which ever way that trader is preaching the market will go. Learn risk management, if you don’t feel confident in the research that you’re doing or the traders that you are following are pointing at different directions just make sure you know why they’re pointing in that directions as it could quickly go both ways as we’ve seen recently. With that being said also know that the market maker always goes for liquidity point blank and simple! This is why the majority of traders are unsuccessful in this game because the easy information to learn online for free teaches you stuff that large trading firms have algorithms to find And come sweep in your losses to their profits.
I can’t necessarily say that the exchanges are our biggest worry, but it’s always made me believe most likely they are considering most of these exchanges are also trading as market makers, probably some insider trading with alot of them. The current element of little laws and wishy washy regulation (as much as it will likely stunt this bull run for a few months, or maybe not… being that Trump has given US regulating agencies 180 days from January to have firm regs in place) albeit, Some that are reading this, I’m sure take advantage of it yet, once it’s set in place we will have a little less wild, wild West and less decent traders in traditional markets who hate crypto because of the manipulation and the rug poles and what not will and I’m just guessing here most likely have a clear path to becoming a more profitable trade.
I’m not here to demonize exchanges just keep in mind they have all of the information that you have Placed on their exchange and given them freely by checking off the terms of service and signing up for your account. Lots of these exchanges still have very little regulation and trust you, Me that they are raking in as much as they possibly can to the extent of the little regulation in the country, they are regulated in if they are even bound to abiding by it, as I’m sure, as we know, some folks have already been arrested and indicted for certain things that I will leave for you to search and find on your own. But, my point being is you need to also be very careful of the exchanges that you choose.
In my best opinion, the exchanges with the most amount of liquidity on them makes it more difficult for manipulation to happen yet, it sure still does!
As always friends, stay profitable and I hope this rant that I just went on, helps you in someway over this Easter weekend and I pray you all have an amazing time with your families and if not, then have an amazing time trading and I hope my words have helped!
Stay Profitable,
Savvy

Xrp - Don't Underestimate The Bulls!Xrp ( CRYPTO:XRPUSD ) is bullish despite the recent drop:
Click chart above to see the detailed analysis👆🏻
Yes, we have been seeing a quite strong correction of about -50% on Xrp over the past couple of months. But no, this bullrun doesn't seem to be over yet but instead Xrp is creating a significant bullish break and retest formation. So if we get the bullish confirmation, we might see new highs.
Levels to watch: $1.8, $3.0
Keep your long term vision,
Philip (BasicTrading)

XRP AND CRYPTO WHERE DO WE STAND NOW? 🔥 Hey hey, hope all is well, it's another day and another chance to make a change and difference so let's keep at it and give it our best.
🔥 Last few weeks as shown in the chart below we've been following XRP which has been stuck within this descending channel and dragged down along with the S&P 500 as the market took a dive the last few weeks with Trump's tariffs and all the uncertainty surrounding him.
🔥Next we'll look to our 1 hour chart depicting that exit from our descending channel with the horizontal channel as well signifying strength above our $2.00 mark with bulls currently taking the lead, especially as the S&P 500 and market has been more optimistic the last few days contributing to things.
🔥 Main thing right now is to watch that horizontal level and that $2.3 mark which has proved to be resistance a couple times already so we can look to that for a pivot or possible breakout indicator when we come back up again to that mark so I'd set some alerts for that as well as $2.15 which is the top of our horizontal channel. I've been following this channel since the 19th and we can see just the kind of impact it'd had on price action from when we formed this on the 19th as shown below:
🔥 Since then it'd been pretty clear that once we exited the descending channel traders then took to that horizontal channel for price action, indicators as we can see we fell out of the channel once or two before getting pulled back in and breaking out and above the channel bringing us to where we currently sit above it and with that 200 EMA underneath us.
🔥 Next few days I would keep mindful of that 200 EMA as well as the channel, no doubt if we fall back within the channel we'll likely be caught up with some sideways trading action again as traders search for the next breakout or fall depending on how the market sentiment is next week, most of that will fall upon Trump and his words.
🔥 It should be noted that in the last few day's Trump's tone and stances have shifted with him essentially turning down the flame as he expressed, especially after Monday in which trump met with the CEO's for Walmart, Target, and Home Depot which are amongst three of the nations largest retailers with the CEO's warning trump on the effects of his tarrifs and how it would leave shelves empty and disrupt their supply chains. This meet seemingly promtped Trump to shift his stance announcing on Tuesday that he was in the works on trade talks with China looking at much lower tariff deal than the current 145% and clarifying that he had no plan or intention on firing Powell which spread fear and uncertainty in the market last week with some rumors floating around. So we'll have to see what stance Trump takes next week and if he can keep the flame down, and linked below is a reference link to an article for anyone else that wants to read up more:
www.axios.com
🔥 As always, so grateful for the support and everything, appreciate you guys and wishing all the best till next, let's keep our heads up and keep pushing!
Best regards,
Rock'

XRP is looking like it may trade back to the equilibrium zone.XRP has been struggling to gain a significant amount of ground and is, in my opinion, one of the most heavily manipulated cryptos in the entire cryptosphere. That should tell you something about its long-term potential if the powers that be are willing to put so much time and effort into keeping its price suppressed.
Good luck, and always use a stop-loss!

XRPAs we bear the end of April, we should see continuation to the upside eyeing $2.50.
May is filled with ETFs going Live, Paul Atkins will come to a conclusion on the XRP v SEC case, plus many more catalyst.
Once we break $2.50 we will hit $3, very quickly. From there, the upside is hard to predict. We've seen $5 - $100 by the end of year, but in all honest. We must stay patient, and continue to stack our bags.
THIS IS NOT FINANCIAL ADVICE. IT IS MY OPINION ONLY.

XRP/USD WILL CRASH! THE BEST OPTION FOR ENTRY! 99%Why I think it is going to happen I don't think , to explain myself , whoever reads this article has every right to pass it by and not pay attention , but isn't this your chance now , I tell a tale , He who has not opened the door , he will never know what lies behind itGood start for entry shortFrom today on I will upload my analysis as well as my prediction totally for free, if you think I am right you can make your trades and like this post. Stay tuned for more like this in the future. Risk is your responsibility.My prediction which will come true

UPDATE ON XRP ANALYSISXRP/USD 4H - As you can see price has played out perfectly since the analysis that was sent out to you guys earlier on in the week.
Those of you who may have sold off some of your XRP could look to buy back in when we have confirmation of the next impulse.
I believe now we will see price correct itself trading us right the way down, putting fear in those who are unsure on the future of XRP, this will give us the opportunity to buy in at a great price later down the line.
I have gone ahead and held the coins I have and will continue to purchase further coins once we see price trade us lower down and into the Demand Zone I have marked out for us.
I will keep you all updated on anything I decide to do with this pair, should I buy in more or sell of coins I have I will let you all know!

Long - XRP (Weekly Chart)Long Swing Position
Perfectly bounced from .618 and RSI above 50. Expect the bullish momentum
Entry : $2.15
Resistance: $2.3
PT1: $2.7
PT2: $3.39
PT3: Update after crossing PT2
Stop loss: If it shows sign of weak rally to the upside, RSI cross below 50. Stop loss below fib 0.5 at $1.9 & monitor price movement when hitting fib 0.618 -> stop loss below it or re-entry when showing strong rally sign.
