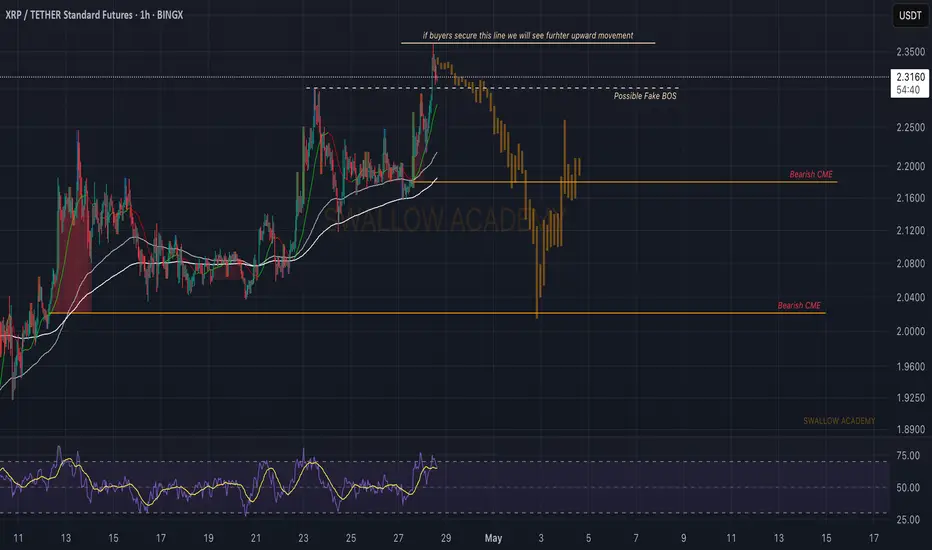
Ripple (XRP): Possible Fake-out Forming | Fill of CMEsRipple coin is showing some sort of weakness right after we had a decent break of structure and now we might be going to a fakeout here.
Why do we see a possibility of a wakeout? It's due to the CME gap that was formed when the price went for a break of structure so we might see a sharp fakeout, which then would give a good entry for the downward movement from there.
Swallow Academy
XRPUSDT.P trade ideas
XRP/USDT: BUY LIMITHello friends
Due to the price rise, you can now see that a double top pattern has formed at the price ceiling, which indicates a correction. Therefore, we have identified good support areas for you to buy in steps and with capital management and targets.
*Trade safely with us*

XRP Nears Triangle Apex: Breakout to $2.30 Incoming?XRPUSDT is heating up! Approaching apex of the Triangle!
Will we see a breakout to $2.30? Or possibly to $2.03!
Check the 1H chart & watch the breakout!

XRPUSDT The Calm Before the Storm: Major Breakout Loading…BINANCE:XRPUSDT has been trading within a well-defined horizontal channel for an extended period, signaling a prolonged consolidation phase. This kind of price behavior often precedes a major breakout, and all signs now point toward an explosive move to the upside.
What makes this setup even more compelling is the presence of an inverse head and shoulders pattern within the channel a classic bullish reversal formation. This pattern, forming after a long sideways trend, adds serious weight to the bullish narrative. It suggests that the accumulation phase is coming to an end, and buyers are preparing to take control.
A breakout above the upper boundary of the channel would confirm the pattern and could trigger a strong rally. Once XRP breaks out with volume, it may leave the consolidation zone behind for good and momentum could carry it to much higher levels.
Traders should watch closely for confirmation and manage risk accordingly. Always use a stop-loss to protect your capital. The opportunity is clear. CRYPTOCAP:XRP is gearing up, and the breakout could be unstoppable.
BINANCE:XRPUSDT Currently trading at $2.19
Buy level : Above $2.2
Stop loss : Below $1.95
Target : $3.5
Max leverage 3x
Always keep stop loss
Follow Our Tradingview Account for More Technical Analysis Updates, | Like, Share and Comment Your thoughts

XRPUSDT will go uphi traders,
Let's have a look at XRPUSDT on 1D time frame.
The price broke the downsloping resistance, and the trend reversal may be around the corner.
I'm expecting the price to test 3,35 within the next 3 months.
Entry, targets (take profit levels) and stop loss are shown on the chart

[XRP] 2025.04.18***Follow SEOVEREIGN to receive real-time alerts.
**Boosts help SEOVEREIGN continue analyzing more assets.
**Our team regularly publishes in-depth reports on the cryptocurrency market.
XRP has been showing a steady upward trend after establishing support near the 2.04 level.
The current chart structure is interpreted as part of a B-wave correction phase, which may serve as a foundation for a potential medium-term bullish reversal.
A detailed wave count has been marked in the idea for further reference.
Projected target levels are as follows:
First target: 2.1665
Second target: 2.2478
Third target: 2.2751
In the short term, a double bottom formation has been identified, and a sustained rebound is likely to unfold from this support structure.
This setup provides a strong basis for defining key levels within the medium-term bullish scenario, and offers valuable signals for anticipating the next wave progression.

XRP Waiting for the D1 channel to break and the rally to beginBINANCE:XRPUSDT
Ripple currency conditions on the daily time frame are very tempting for buying. A positive hidden divergence has formed in a weekly support area, where we expect growth to the set prices after the channel is broken from above.

XRP Short Term Analysis (4H)XRP is exhibiting bullish signals supported by multiple technical indicators.
An Inverse Head and Shoulders pattern has clearly formed on the chart, indicating a potential reversal from the previous bearish trend. Additionally, the downward trendline appears to be breaking out with increasing volume, which reinforces the breakout confirmation.
From an Elliott Wave Theory perspective, we seem to be in wave 3, which is typically the most impulsive and extended leg of the five-wave cycle.
Given the structure and momentum, a conservative price target lies at the $2.30 level, representing the measured move from the neckline of the H&S formation.
Further upside may follow if wave 3 unfolds as expected, but short-term corrections should also be anticipated.
Risk management remains essential, as macroeconomic factors and fundamental news may cause volatility.
— Thanks for reading.

DeGRAM | XRPUSD Retest of Support Level📊 Technical Analysis
Breakout from wedge
XRP/USDT broke above a descending wedge, confirming support near $2.00.
Key resistance
The next target is $2.30, aligned with the upper resistance trendline.
Predictive scenario
If support holds, XRP could climb toward $2.30 with room for further upside if broken.
💡 Fundamental Analysis
Ripple gains momentum as legal clarity improves. Positive sentiment around altcoins and rising market activity support a bullish outlook.
✨ Summary
XRP’s breakout and legal tailwinds point to continued growth. Watch $2.30 for potential breakout confirmation.
-------------------
Share your opinion in the comments and support the idea with a like. Thanks for your support!

Can XRP crack resistance and rally straight to $2.50?Hello and greetings to all the crypto enthusiasts, ✌
All previous targets were nailed ✅! Now, let’s dive into a full analysis of the upcoming price potential for Ripple 🔍📈.
Ripple appears poised for a potential breakout above its current descending channel in the coming days.
A projected upside of at least 16% is anticipated, with the primary target set at $2.50.
This level aligns closely with a key resistance zone, marking a critical point for bullish momentum.📚🙌
🧨 Our team's main opinion is: 🧨
Ripple may soon break out of its downtrend, targeting a 16% rise toward the key $2.50 resistance level.📚🎇
Give me some energy !!
✨We invest hours crafting valuable ideas, and your support means everything—feel free to ask questions in the comments! 😊💬
Cheers, Mad Whale. 🐋

Xrp (Ripple)Ripple
Xrp usdt Daily analysis
Time frame daily
Risk rewards ratio >3.2 👈👌
Target 3.2$
Ripple technical analysis ✅️
My last short position reached the target.
Head and shoulders pattern completed.
Now it is a good time to start
My critical area is red box that you see on the chart. It is very important area .
If Ripple can reach and break this resistance, we will have a good pump
But now 3 _3.2$ is a good target

XRP looking bullishXRP is breaking the descending trendline with a inverse head and shoulder reversal pattern.
If we manage to stay above this trendline i believe we will test the ATH soon.

XRPUSDT: Turning Bullish, Chart Signals +20% Upside PotentialHey Realistic Traders!
Is XRPUSDT Gearing Up for a Major Bull Run or Just Faking Us Out Again? Let’s Break It Down...
XRPUSDT has finally broken out of its bearish channel, and price action is holding strong above that zone. This is a solid indication that bulls are gaining control. Shortly after the breakout, a smaller falling wedge formed, which is typically a bullish continuation pattern.
What adds further interest to this setup is that the falling wedge appears to be developing during what may be Wave 4 of the Elliott Wave cycle. While Wave 4 is usually corrective, it can occasionally take the form of a wedge or triangle-like pattern. If this interpretation holds, it would suggest that a bullish Wave 5 may follow, often the final impulse leg in the trend.
Zooming into the 4-hour chart, a fresh breakout has just occurred, further strengthening the bullish case. Adding to this, the MACD has printed a golden cross, a classic momentum signal that supports the outlook for continued gains.
With all these factors aligning, the first target is set at 2.5454. A minor pullback could occur at that level before price continues its move toward the second target at 2.8535. Both targets have been calculated using Fibonacci extension levels from the current bullish wave.
This outlook remains valid as long as the price stays above the stop-loss level at 2.0355.
Support the channel by engaging with the content, using the rocket button, and sharing your opinions in the comments below.
Disclaimer: "Please note that this analysis is solely for educational purposes and should not be considered a recommendation to take a long or short position on Ripple.

XRP 2.2 is breakout level for take offXRP is near to its breakout level of 2.2, after breakout may be it will cross 2.5 ad 2.8 levels.
Note: This is not a buy/sell call, trade at your own will. Use stop loss too.

XRPUSDT SHORT TERMIf the uptrend continues and we see a bullish Total chart (i.e. we get volume support) then this pose will work.

XRP ANALYSIS🚀#XRP Analysis :
🔮As we can see in the chart of #XRP that there is a formation of "Falling Wedge Pattern". In a daily timeframe #XRP broke out the pattern. Expecting a bullish move in few days if #XRP retest the levels
⚡️What to do ?
👀Keep an eye on #XRP price action. We can trade according to the chart and make some profits⚡️⚡️
#XRP #Cryptocurrency #TechnicalAnalysis #DYOR

XrpusdtXrp broke out a bullish flag pattern and this could be a continuation to the xrp bullish run and a possible short term increase in price
XRP Trade!!XRP is getting ready for a big move to the upside
I think is a good time to accumulate or enter a long position with low leverage.

XRP?
Hi,
As per chart.
This is my plan. on Bullish scenario
There's CPI news on 15/5/25
- It could be a trajectory point
I could start buying 2.15 (reason- broke trendline)
I could start buying 2.20 (reason- local resistance successful break)
Then monitor from there.
Anyone can tell you anything. EOD decision will be yours.
Buying BTC at 60 or 600 makes no difference. When its now 100K :)
As long we are optimistic in the value per se.
Not your guru
& All the best

head an shoulder before running uppersonal opinion that it will actually play out and go down to 2$ ich before next leg up. incertenty in the market will make it go down and help fuel the next leg up. buy order placed at 2.05$ as i use low leverage and even if it wick down to 1.88 i wont get liquidated.
those post are for my personal use as record and training aid ...

XRP 2025.05.06🔔 Follow SEOVEREIGN to receive real-time alerts.
🚀 Your boosts drive SEOVEREIGN to analyze even more assets.
📊 Our team regularly publishes comprehensive crypto market reports.
📉
XRP appears poised for a potential short-term decline. From a technical standpoint, a Crab harmonic pattern has completed—commonly seen as a signal for a bearish reversal.
Based on this pattern, we’ve identified the following short-side price targets:
Target 1: 2.04
Target 2: 1.97
The Crab pattern is known for marking strong reversal zones near the highs. In this case, XRP is trading directly within the Potential Reversal Zone (PRZ), making this a technically justified entry point for a short position.
As with any trading strategy, risk is inherent. It's crucial to define clear stop-loss levels and remain flexible to price action as the setup unfolds.
This is a time that calls for precision over boldness. Let the pattern do the work—a disciplined, technical approach is your best edge in managing risk.

The future of XRPI am currently assuming these three futures trades, taking into account the trend lines and my indicator signals. On the daily timeframe, I consider the RSI 50 crossover as a necessary starting point.

The future of XRPAt the moment, I assume these three futures, taking into account the trend lines and the signals of my indicator. I see the RSI 50 cross on the daily timeframe as a necessary starting point.
