XRP/USDT – 3D Long Signal Setup
📅 April 29, 2025
The system is about to trigger a long entry on the 3D timeframe.
All major conditions are now aligned:
✅ MLR > SMA > BB Center > PSAR
✅ Price is above the 200 MA on both the 3D and 1D timeframes — reinforcing the bullish bias.
📍 Entry Plan:
Prepare for a potential long entry at this 3D bar close.
Suggested stop-loss: around 2.08, matching the current PSAR level on the 1D chart.
This setup shows system strength across multiple timeframes, but as always — discipline first, excitement second.
🔔 Keep an eye on updates and thank you for reading! 📈📊
XRPUSDT.P trade ideas

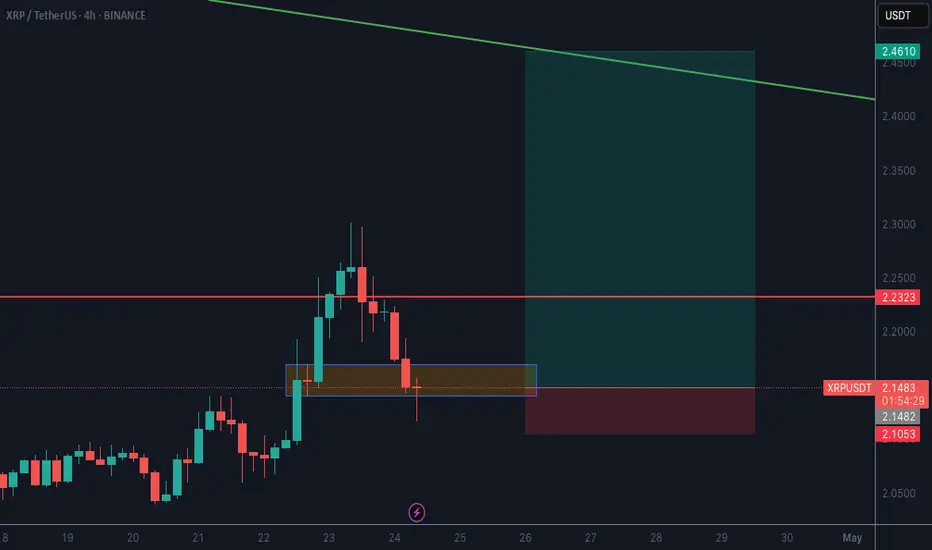
Buying XRP Ripple long XRPUSDt Bias Trade! The Breakdown inside!Again we have a 🟢SeekingPips🟢 plan where ⏳️ TIME was the MAIN factor in the SUCCESSFUL OUTCOME of our TRADE PLAN.🚀
If you've been following 🟢SeekingPips🟢 for sometime already you will know that we ALWAYS FAVOUR 🕝TIME🕖 OVER PRICE.
🔥I would even go as far and say that PRICE comes a DISTANT 3rd place when compared to TIME & VOLUME.🤔
BUT WHY❓️
That is a Vvveeerrryyyy LONG STORY that will require it's very own very long CHAPTER when 🟢SeekingPips🟢 Finally gets around to the eagerly awaited super blog so stay tuned....
Having seen that the GREY ZONE identified as 🟢 SeekingPips 🟢 Bull & Bear Bias level worked very well, you can also see that the first level of resistance identified came in at the orange level at 2.3615 whilst the printed high up until now came in at 2.3630 (Accuracy👌)
48hrs was also our minimum time window for the grey zone to present some kind of trade opportunity which it did perfectly. ( It's MATH not MAGIC honestly😉)
Note the 🔵 BLUE ARROW LOW 🔵 significant swing point created before 🌍SeekingPips trade analysis signal and just below our GREY BIAS ZONE remained unvisited👌.
Wether or not you entered a bullish trade at MARKET PRICE at time of post ( I always suggest you use your own entry signal ) OR waited for a LIQUIDITY SWEEP at those local lows for the BUYERS to easily pair with at the 🟢GREEN ARROW🟢 you would have enjoyed anything from a 3.2 - 5.2 REWARD TO RISK TRADE by the time our FIRST HIGHLIGHTED zone of RESISTANCE was hit which came into play at the
2.3615 level 🔴RED ARROW🔴.
The 🟣PURPLE/MAGENTA🟣 arrow added CONFLUENCE to the BULLISH BIAS TOO .
🚥Stay tunned for MORE TRADE ANALYSIS as the week progresses.🚥

Possible SELL on XRPUSDTIt's looking like it might break the counter trendline and continue going downwards.

Ripple-XRPUSD Periodic Analysis-ssue 79(Free and open access)The analyst believes that theprice of Ripple will increase within the time specified on the countdown timer. This prediction is based on a quantitative analysis of the price trend.
___Please note that the specified take-profit level does not imply a prediction that the price will reach that point. In this framework of analysis and trading, unlike the stop-loss, which is mandatory, setting a take-profit level is optional. Whether the price reaches the take-profit level or not is of no significance, as the results are calculated based on the start and end times. The take-profit level merely indicates the potential maximum price fluctuation within that time frame.


Crypto XRPUSD Bear Bull Zone! What is Ripple Xrp next Big move? 🌎 Crypto XRPUSD Bear Bull Zone! What is Ripple Xrp next Big move?
🟢SeekingPips🟢 Says...
"when levels are as clean as this we can always use one of our intermediate TIMEFRAMES".
In todays case that task falls onto the 📉 120 MINUTE CHART📈
The GREY ZONE is our BIAS going forward for at least the next 48 HOURS.
Therefore 🟢 SeekingPips 🟢 is strictly BULLISH ABOVE & BEARISH BELOW the GREY ZONE.
🚥 SIMPLICITY is a KEY ingredient to having LONGEVITY in the FINANCIAL MARKETS 🚥

$XRP broke structure to the downsideCRYPTOCAP:XRP broke structure to the downside on the weekly, tapped into the red resistance box, and is getting rejected.
Unless CRYPTOCAP:BTC and the market keep pushing, this one’s got work to do — better charts out there IMO.

Update to my last chartThis is an update to my last chart. We are moving along nicely. lines are resistance and support. Not financial advice. Have a blessed day!!


XRP Long Pull back into demand zone between 2.1237 and 2.17.
Expecting a reversal from this area. Good long opportunity.
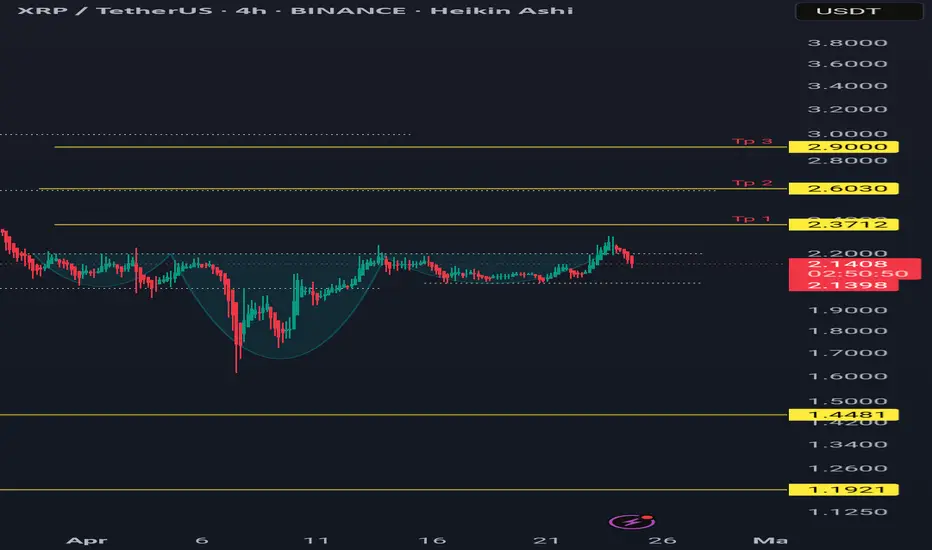
Xrpusdt formed a ihead and shoulder patternXrpusdt formed a ihead and shoulder pattern
Buy area
2.2-2.05
Targets are 2.37 tp 20%
2.6 tp 50% then move to breakeven
2.9 100%
Invalidation bellow the right shoulder
2.02
XRP?
Hi,
Intraday idea:
Yest made high 2.25-2.28 range
Today @ discount 2.17 about 10c
If we think; there will be a stronghand coming
we'll be buying range.. slowly.
All the best.
May you always success

XRP LOOKS GOOD.As of now the BTC is healing it self so we are looking some bullish volume in market which is good for market... So i noticed a bullish panent in XRP...

XRP Struggles at ResistanceXRP Struggles at Resistance
XRP touched the upper band of the falling channel and received the first rejection here. It was rejected from the same area before (red circles).
🔹 The price is now around $2.21 and very close to the resistance of the falling trend.
🔹 The RSI side is trying to stay above the 60 level. This means that the momentum is still positive, but it is also close to the overshooting zone.
🔹 The range of $1.96 - $2.00 is now critical support. If it is broken, there may be a possibility of retracement to the $1.50s again.
🔹 For the continuation of the rise, it is imperative to throw this red falling trend with a net close. Otherwise, the possibility of rejection from this area and return to the horizontal band increases.
The blue horizontal line is important; If the daily closing candle comes on it, it will break the downtrend. This is also the ceiling zone of the falling trend channel.
If the breakout comes, a rapid rally begins, otherwise a correction is on the agenda again.

A Guess on XRP MaybeA Guess on XRP Maybe
Thought id just have a look at the possible future,
Lets see if im learning or not.

XrpusdtXrp broke out a bullish flag pattern and this could be a continuation to the xrp bullish run and a possible short term increase in price
XRP gets a chance to grow, but there's a condition... XRP is breaking through the descending resistance. The breakout bar is testing the liquidity zone, but it is not going to turn around yet. Continued assault of 2.186 may lead to a break through consolidation resistance and further growth
Scenario: A smooth approach and consolidation in front of 2.186 will increase the chances of resistance breakout and growth. XRP as a whole has positive chances to strengthen to 2.4777

$XRP Breakout alert XRP breakout alert!
Price flipped key support and holds above the 30 EMA on the 12h chart.
A move toward the mid-channel resistance around $2.76 is on the table.
Entry: CMP
Target: $2.76
SL: Below $2.10
Bullish setup brewing 🔥...DYRO NFA

.55 Inverse H&S move incoming...Inverse Head & Shoulder setup here with a potential .55 move up depending on how you count. Pro Blue Osc Heading back to 0 line with plenty of RSI to run.

Check support near 2.2582
Hello, traders.
If you "Follow", you can always get new information quickly.
Please click "Boost" as well.
Have a nice day today.
-------------------------------------
(XRPUSDT 1D chart)
XRP's important support and resistance area is near 2.6013.
When this area breaks upward, it is the breakout trading period.
However, in order to feel more stable, buy when support is confirmed near 2.2582.
Therefore, XRP is still in an ambiguous position to consider it as a buying period.
It is not good to think that you can make more profit by buying in advance when there is not much left anyway.
The reason is that it is highly unlikely that a suitable countermeasure will be made.
Therefore, even if you buy at a slightly higher price, it is best to buy when it fits your own rules, that is, your trading strategy.
-
Like BTC, since the HA-Low indicator has been leveled off since it was created, if it rises above the HA-Low indicator this time, it is likely to lead to an additional rise.
If it does not rise and falls, it is highly likely that the price will continue to rise only if it maintains above the M-Signal indicator on the 1M chart.
-
Thank you for reading to the end.
I hope you have a successful trade.
--------------------------------------------------
- This is an explanation of the big picture.
I used TradingView's INDEX chart to check the entire range of BTC.
I rewrote the previous chart to update it while touching the Fibonacci ratio range of 1.902 (101875.70) ~ 2 (106275.10).
(Previous BTCUSD 12M chart)
Looking at the big picture, it seems to have been following a pattern since 2015.
In other words, it is a pattern that maintains a 3-year bull market and faces a 1-year bear market.
Accordingly, the bull market is expected to continue until 2025.
-
(Current BTCUSD 12M chart)
Based on the currently written Fibonacci ratio, it is displayed up to 3.618 (178910.15).
It is expected that it will not fall again below the Fibonacci ratio of 0.618 (44234.54).
(BTCUSDT 12M chart)
I think it is around 42283.58 when looking at the BTCUSDT chart.
-
I will explain it again with the BTCUSD chart.
The Fibonacci ratio ranges marked in the light green boxes, 1.902 (101875.70) ~ 2 (106275.10) and 3 (151166.97) ~ 3.14 (157451.83), are expected to be important support and resistance ranges.
In other words, it seems likely to act as a volume profile range.
Therefore, in order to break through this section upward, I think the point to watch is whether it can rise with support near the Fibonacci ratios of 1.618 (89126.41) and 2.618 (134018.28).
Therefore, the maximum rising section in 2025 is expected to be the 3 (151166.97) ~ 3.14 (157451.83) section.
To do that, we need to look at whether it can rise with support near 2.618 (134018.28).
If it falls after the bull market in 2025, we don't know how far it will fall, but considering the previous decline, we expect it to fall by about -60% to -70%.
So, if the decline starts near the Fibonacci ratio 3.14 (157451.83), it seems likely that it will fall to around Fibonacci 0.618 (44234.54).
I will explain more details when the downtrend starts.
------------------------------------------------------

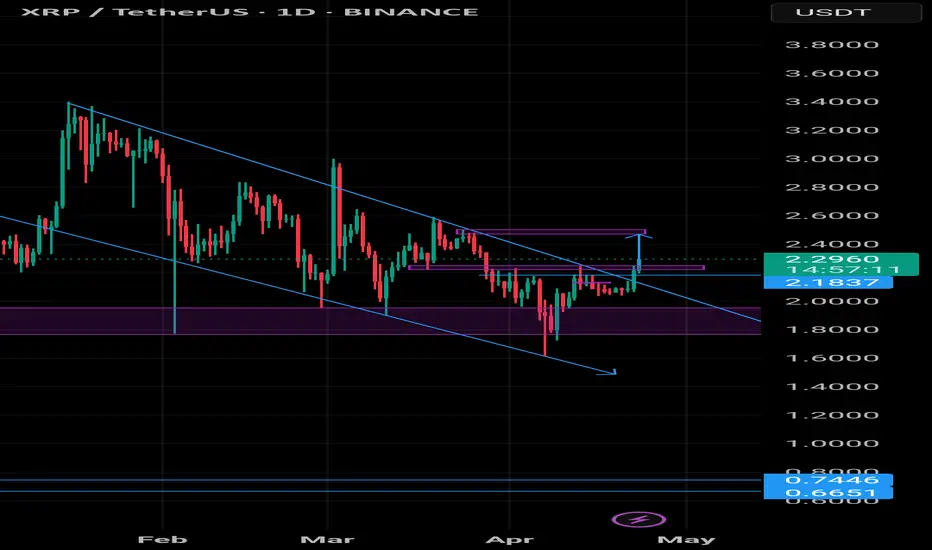
XRP is showing strength after defending the $2 XRP is showing strength after defending the $2 value area low, rejecting downside pressure from the recent swing low at $1.60. The bounce opens the door for a move back into the value area high region.
Key Points:
$2 support has held, with a confirmed swing failure pattern below $1.60.
Value area high near $2.30 aligns with descending channel resistance.
While price remains within a high time frame descending channel, the current bounce could trigger a short-term rally toward the top of the range. As long as $2 holds and volume improves, a 15% upside rotation remains likely. But without volume confirmation, price may stay range-bound.
XRP is holding key support above $2 after a swing failure at $1.60, setting up a potential 15% move toward the range high. However, low volume remains a concern, and price action may stay rotational within a descending channel until a confirmed breakout occurs.

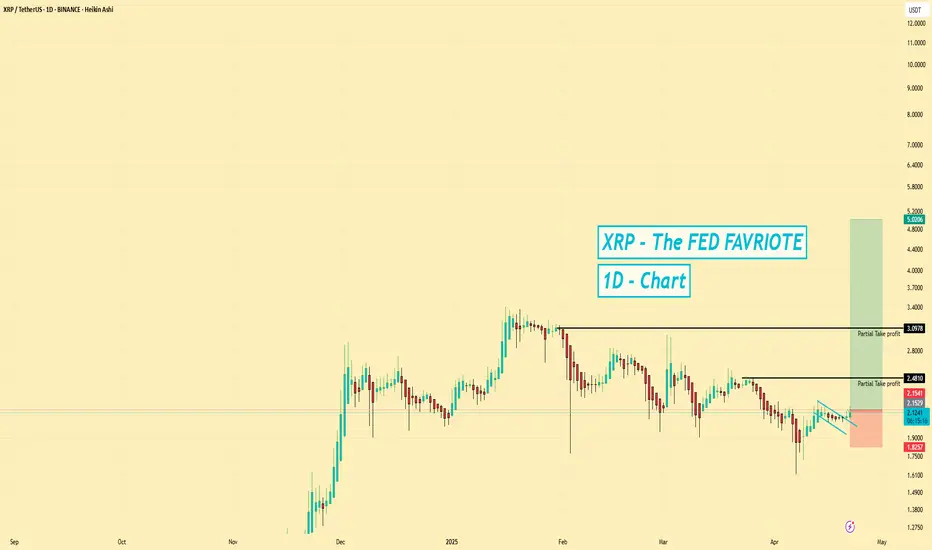
XRP | Long | Breakout From Parallel Channel | (April 2025)XRP | Long | Liquidity Flip & Breakout From Parallel Channel | (April 2025)
1️⃣ Short Insight Summary:
XRP — often called "the chosen one" by some for its potential role in future financial systems — is showing signs of a breakout after a long period of decline. Liquidity inflows and a channel breakout point to possible upside ahead.
2️⃣ Trade Parameters:
Bias: Long
Entry: Around current breakout zone (~$0.91–$0.95)
Stop Loss / Invalidation: Below $0.88–$0.89 zone
TP1: $2.30
TP2: $2.50
TP3: $3.00
Final Target: $5.00+ (longer-term target)
✅ This setup includes partial profit-taking along the way, while holding a portion for potential extended moves.
3️⃣ Key Notes:
🔹 Fundamentals & Sentiment: XRP continues to attract speculation as a possible backbone for future digital financial systems, standing alongside Ethereum, Solana, and Cardano. Fundamentally, it's stable — though the broader crypto market sentiment (especially Bitcoin and dominance levels) needs to align for a major move.
🔹 Technical Setup:
XRP is breaking out of a long-standing parallel channel to the upside. Recent liquidations of over-leveraged short positions have brought fresh liquidity into the market — a classic signal that a reversal may be forming. With "money magnet" levels like $2.30 ahead, the path toward higher targets looks increasingly possible.
🔹 Market Context:
To sustain this move, we want to see Bitcoin dominance drop and Altcoin dominance rise — that would fuel capital rotation into assets like XRP. Watch those charts closely as this unfolds.
4️⃣ Follow-up Note:
I’ll monitor structure around each key level and may post updates if momentum strengthens or invalidation triggers. As always — position sizing and risk management are essential.
Please LIKE 👍, FOLLOW ✅, SHARE 🙌 and COMMENT ✍ if you enjoy this idea! Also share your ideas and charts in the comments section below! This is best way to keep it relevant, support us, keep the content here free and allow the idea to reach as many people as possible.
Disclaimer: This is not a financial advise. Always conduct your own research. This content may include enhancements made using AI.
XRP looks perfectly coiled up.If this fails and breakdown
I’ll be very surprised!
XRP has held 2.00 as a great support now it’s just all about patience.
