YFIBTC trade ideas

Bullish reversal on YFIBreak and close above the horizontal line could indicate a change of sentiment. May even look to enter on a retest of the horizontal line.
Larger diagonal break with volume would confirm. Setting a moderate target (green line).
All eyes on BTC.


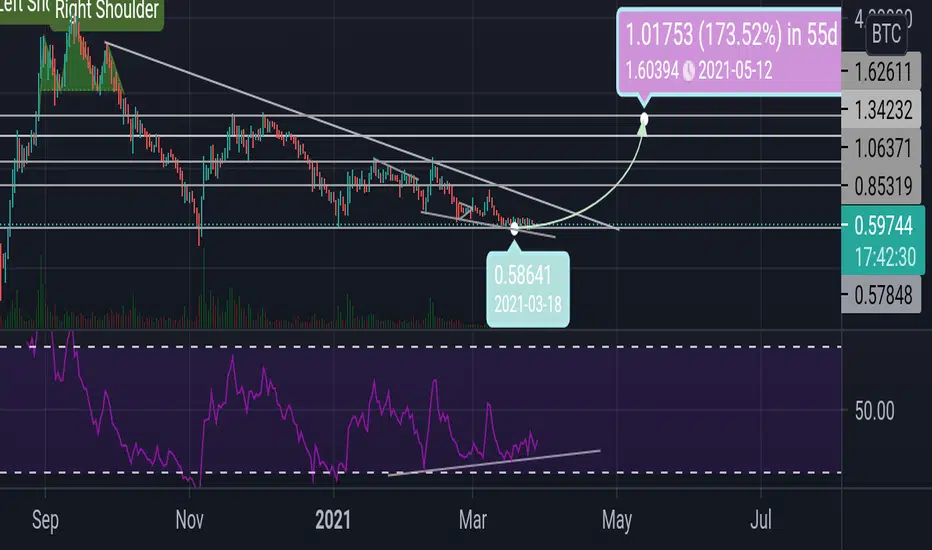
YFI Going to 1.5-2.0 BTC ?BINANCE:YFIBTC
A few days ago, I warned about the Yafi in the @Bitexgroup, which has the potential to break its triangle and just needs to surge a good volume:
As I expected, the breakout happened with a full candlestick and good volume, and it touched the initial resistances,
For now , Breaking the Important S/R level can push #YFI to 1.4 to 2 bitcoins
I will analyze the Yafi dollar chart in the next analysis

Is yfi alive ? If yfi alive , pump here , because bullish divergence seems and touch heavy support here , buy in this zone is low risk and high reward
Crypto|YFI/BTC|LongLong YFI/BTC
Activation of the transaction only when the blue zone is fixed/broken.
The author recommends the use of anchoring fixed the blue zone, this variation is less risky.
If there is increased volatility in the market and the price is held for more than 2-3 minutes behind the activation zone after the breakdown, then the activation of the idea occurs at the prices behind the activation zone.
The idea is to work out the resistance level .
* Possible closing of a trade before reaching the take/stop zone. The author can close the deal for subjective reasons, this does not completely cancel the idea and is not a call to the same action, you can continue working out the idea according to your data, but without the support of the author.
+ Maybe right now we will go even lower, then it's okay, the idea is not activated and simply canceled.
+ ! - zone highlighted by the ellipse is a zone of increased resistance, in this area there is a possible reversal for a correction, please take this factor into account in this transaction.
The "forecast" tool is used for more noticeable display of % (for the place of the usual % scale) of the price change, I do not put the date and time of the transaction, only %.
Blue zones - activation zones.
Green zones - take zones.
The red zone - stop zone.
Working out the stop when the price returns to the level after activation + fixing in the red zone.
Orange arrow - the direction of take.
Black arrow - neutral scenario without activating the trade.
The red arrow - the direction of the stop.
SUM PNL: This parameter displays the total % of all closed ideas of the "new" format (according to the author) for this sector at the time of publication of the idea. The calculation is very "clumsy" just the sum of the profits of all the ideas, based on this indicator, you can more accurately assess the risks when working with my ideas of this sector. I present you the construction of the idea, you can use it yourself as you like based on your subjective view and risks, the calculation of the PNL indicator is carried out only on transactions that the author closed on TV in manual mode or by take.
P.S Please use RM (risk management) and MM (money management) if you decide to use my ideas, there will always be unprofitable ideas, this will definitely happen, the goal of the system is that there will be more profitable ideas at a distance.


YFI BTC - 0.6 area of consolidation Seems to be an area of consolidation on the 1 day and 4 hour chart.
Will we see it drop to 0.5 btc?

#YFIBTC Trading planHello friends!
The chart clearly shows the limit buyer.
For several days, the pair traded in a small channel between 0.59-0.63358
At the exit from the channel or the breakdown of the mirror level 0.63358, growth is expected.
Stroke potential + 20%
✔ Do not forget to trade using your own trading system and with stops!
✔ If you like what I do, put 👍 and subscribe! 🙌👀
✔ This is the best gratitude for my work! 💕

YFI BTCLONG SIGNAL
-Wait for the candle to close above the blueline with good volume.
-you can follow the analysis on 1H or 2H timeframe, but the important is the volume.
-Go step by step.
*NB:BLUELINE: entry level
GREENLINE : take profit
REDLINE: stop loss


YFI BTC - holding above EMAI remember when we were charting BTC price parity for YFI.
Maybe those days are long gone for Yearn Finance.
Still candles are holding above the EMA trendline for now after a slowdown of Bitcoin pricings.


YFIBTC - Possible Bullish PatternThe YFI/BTC(Yearn.Finance) is forming a bullish RSI divergence like it did a few days ago before its ~25% increase which indicates a trend reversal.
For safer short term trading, wait until the 50MA & the 200MA make a golden cross on the 30minute/1hour chart.
If YFI breaks below the bottom fib level, I will expect further downward movement. I will be watching the fib levels for support and resistance if YFI begins to trend upwards.

andre hates me and andre hates you and andre hates us allpls andre why do you hate me i love you stop hurting me this hurts i am hurt by you i will not sell you but i am still hurt buy you i hope you see this i hope you know this you hurt me emotionally not financially really but emotionally.


Crypto|YFI/BTC|LongLong YFI/BTC
Activation of the transaction only when the blue zone is fixed/broken.
The author recommends the use of anchoring fixed the blue zone, this variation is less risky.
If there is increased volatility in the market and the price is held for more than 2-3 minutes behind the activation zone after the breakdown, then the activation of the idea occurs at the prices behind the activation zone.
The idea is to work out the resistance level .
* Possible closing of a trade before reaching the take/stop zone. The author can close the deal for subjective reasons, this does not completely cancel the idea and is not a call to the same action, you can continue working out the idea according to your data, but without the support of the author.
+ Maybe right now we will go even lower, then it's okay, the idea is not activated and simply canceled.
+ ! - zone highlighted by the ellipse is a zone of increased resistance, in this area there is a possible reversal for a correction, please take this factor into account in this transaction.
The "forecast" tool is used for more noticeable display of % (for the place of the usual % scale) of the price change, I do not put the date and time of the transaction, only %.
Blue zones - activation zones.
Green zones - take zones.
The red zone - stop zone.
Working out the stop when the price returns to the level after activation + fixing in the red zone.
Orange arrow - the direction of take.
Black arrow - neutral scenario without activating the trade.
The red arrow - the direction of the stop.
SUM PNL: This parameter displays the total % of all closed ideas of the "new" format (according to the author) for this sector at the time of publication of the idea. The calculation is very "clumsy" just the sum of the profits of all the ideas, based on this indicator, you can more accurately assess the risks when working with my ideas of this sector. I present you the construction of the idea, you can use it yourself as you like based on your subjective view and risks, the calculation of the PNL indicator is carried out only on transactions that the author closed on TV in manual mode or by take.
P.S Please use RM (risk management) and MM (money management) if you decide to use my ideas, there will always be unprofitable ideas, this will definitely happen, the goal of the system is that there will be more profitable ideas at a distance.

YFI/BTC (+53% mapped)Entry point: 0.67459
TP1: 0.70491
TP2: 0.75759
TP3: 0.92126
TP4: 1.03000
TP5:
DCA Rebuy: 0.58074000
SL: 0.48478000
RR: 2

Crypto|YFI/BTC|LongLong YFI/BTC
Activation of the transaction only when the blue zone is fixed/broken.
The author recommends the use of anchoring fixed the blue zone, this variation is less risky.
If there is increased volatility in the market and the price is held for more than 2-3 minutes behind the activation zone after the breakdown, then the activation of the idea occurs at the prices behind the activation zone.
The idea is to work out the resistance level .
* Possible closing of a trade before reaching the take/stop zone. The author can close the deal for subjective reasons, this does not completely cancel the idea and is not a call to the same action, you can continue working out the idea according to your data, but without the support of the author.
+ Maybe right now we will go even lower, then it's okay, the idea is not activated and simply canceled.
+ ! - zone highlighted by the ellipse is a zone of increased resistance, in this area there is a possible reversal for a correction, please take this factor into account in this transaction.
The "forecast" tool is used for more noticeable display of % (for the place of the usual % scale) of the price change, I do not put the date and time of the transaction, only %.
Blue zones - activation zones.
Green zones - take zones.
The red zone - stop zone.
Working out the stop when the price returns to the level after activation + fixing in the red zone.
Orange arrow - the direction of take.
Black arrow - neutral scenario without activating the trade.
The red arrow - the direction of the stop.
SUM PNL: This parameter displays the total % of all closed ideas of the "new" format (according to the author) for this sector at the time of publication of the idea. The calculation is very "clumsy" just the sum of the profits of all the ideas, based on this indicator, you can more accurately assess the risks when working with my ideas of this sector. I present you the construction of the idea, you can use it yourself as you like based on your subjective view and risks, the calculation of the PNL indicator is carried out only on transactions that the author closed on TV in manual mode or by take.
P.S Please use RM (risk management) and MM (money management) if you decide to use my ideas, there will always be unprofitable ideas, this will definitely happen, the goal of the system is that there will be more profitable ideas at a distance.

Crypto|YFI/BTC|LongLong YFI/BTC
Activation of the transaction only when the blue zone is fixed/broken.
The idea is to work out the resistance level (global and local).
The global zone is a priority, the local zone can work out as you like, it is just an additional transaction within the global "triangle" of consolidation, you can use the combination of transactions of the two zones at your own risk.
* Possible closing of a trade before reaching the take/stop zone. The author can close the deal for subjective reasons, this does not completely cancel the idea and is not a call to the same action, you can continue working out the idea according to your data, but without the support of the author.
+ Maybe right now we will go even lower, then it's okay, the idea is not activated and simply canceled.
The "forecast" tool is used for more noticeable display of % (for the place of the usual % scale) of the price change, I do not put the date and time of the transaction, only %.
Blue zones - activation zones.
Green zones - take zones.
The red zone - stop zone.
Working out the stop when the price returns to the level after activation + fixing in the red zone.
Orange arrow - the direction of take.
Blue arrow - neutral scenario without activating the trade.
The red arrow - the direction of the stop.
P.S Please use RM (risk management) and MM (money management) if you decide to use my ideas, there will always be unprofitable ideas, this will definitely happen, the goal of the system is that there will be more profitable ideas at a distance.

It’s a Good Buy Opportunity ❕ Sitting Above The Long Term Trend Line ,TA Sides Of This Coin Are Great
✅ Tp 1 : 81000 (20%)
✅ Tp 2 : 1 Btc (48%)
✅ Tp 3 : 1.25 Btc (85%)
🔴 Stop loss zone : 58000 ~ 57500
