ZECUSDT.P trade ideas

ZECUSDT Triangle formation!ZECUSDT (1H Chart) Technical analysis update
ZEC/USDT currently trading at $153.9
zec forming symmetric triangle in 1h chart, if triangle breakout we can expect up move in zec.
Buy level: Above 154.5 (only buy after symmetric triangle breakout
TP 1: $158
TP 2: $163
TP 3: $170
TP 4: $180
Stop loss:$146
Max Leverage: 2x


ZECUSDTCame out of a downtrend forming a rounded bottom and recently broke a strong horizontal resistance at $148 level. Expected a move to the upside.

ZECUSDT is ready to MOVE UP !💎 ZECUSDT / 4H 💎
we have a Good Support zone in 4H time Frame , also we have Good news on RSI indicator !
we can see a possible bounce from here !


Trading Series: $ZECWho doesn't love security? Great entry rn at 153. Bullish AF on this gem! DCA more at 93, TP1 204, TP2 252, TP3 331.
NFA, DYOR.

Zec/Usdt i will talk to you in chart
you can see target and stop loss . R/R IS 1/9 ! Its awesome in spot
if you want use leverage take care !

Zecusdt 1dIt is my personal opinion
Good for swinging
This currency no longer has the ability to break the previous ceiling

ZEC usdtwe are now on an important support area.by maintaining the above range ,we can expect growth up to the black D range in the first stage ,otherwise the situation will be different.

Zec opportunity!!!Zec has broken its down trend channel and did a Pullback to it...in good condition of market we can see a good rising of zec but now it will be risky to enter in this position because of bitcoin's condition....

Patience for ZEC pump1) Resistance is breakout
2) Pullback in resistance that is a new support
Warning: That is not a buy or sell offer, It is just an idea and has an educational aspect!

🔥Zcash short signal#ZEC/USD
🔥Zcash short signal, we hit the resistance zone, now we are falling down.
Subscribe to the channel, fresh signals every day! ✅✅✅

#ZECUSDT (Watchlist) 10/21#ZEC maybe worth it to add this coin to your Watchlist. 👀
Pree "like button" and leaving your "comments" below our ideas is a great thing and supports us to providing more ideas.❤️ (Share it with your folks)
Everything mentioned on the chart (Pattern/Resistance/Support / Breakout/Breadkwon levels, Also R: R)
add to watchlist means the coin we mentioned is forming a pattern or moving near a historical bottom, around or above good support, increase in trading volume , showing a reversal candle, accumulation stage, etc, but no reaction from bulls, so we inform you to add it to your watchlist until the right time for entry.!!
Ps:
we avoid trading any coin if the entire project for it is based on gambling, prostitution, human trafficking, borrowing, and lending, etc.
This is not financial advice, The purpose of these Charts is to give you an idea about coin movement (not buy or sell signal) so before following any idea be sure to do your own research, and follow your risk management. the Cryptocurrency market is very volatile and involves gains and losses as well so know very well what you are heading towards before engaging in it.
The information we mentioned here is a personal effort that is subject to success or failure and we welcome constructive criticism.
Good luck to All.
🙏we ask Allah reconcile and repay🙏

zecusdtHello dear traders, this image is a volumetric thermal map and shows you large purchase or sale orders so that you can find the route more easily in the short and long term.
Here are 150 good price
Be successful and profitable

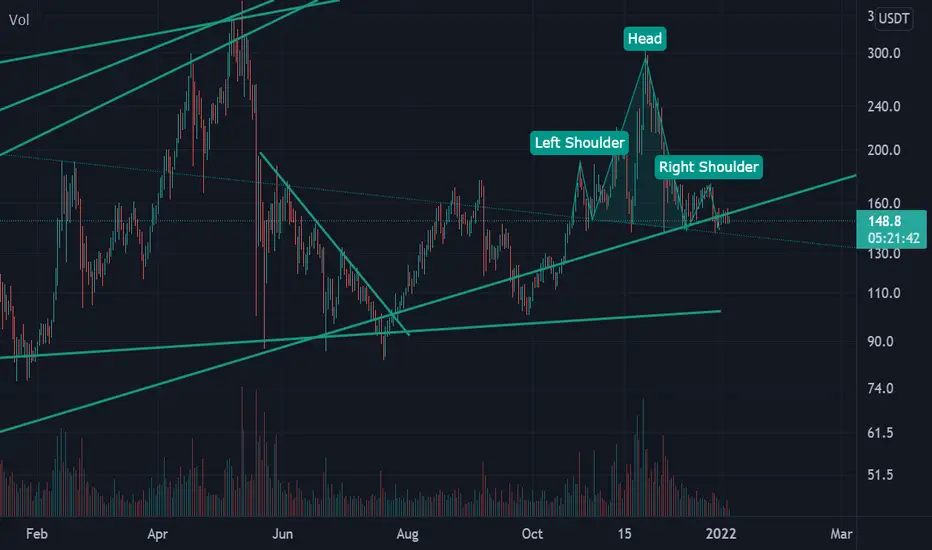
ZEC TRADE ENTEREDZEC inverse head & shoulders confirmed on hourly and position entered. possible retest on neckline before pump.

ZEC PERSONAL ANALYSIS IN THE LONG TERMChart shows common supports and resistances based on the Fibonacci and price action. The total evaluation for the ZEC token is neutral-bearish. The coin itself did not establish any higher highs, even though it was still in the recovery phase after the FOMO pump, it got rejected for a triple top on the same resistance which concludes the bearish tone that no investors are interested in keeping it in that range which can send long term confidence investment in this asset decently low. The coin has a very stable customer interest below the 0.236 and some areas above it.
The recommended strategy for this coin is to long it from within the .236 and lower areas of .382 FIB during a BULLTREND in both larger and smaller time frames. If the smaller time frame is bearish and the general trend is bullish, you may find the neutrality of the coin difficult to trade/scalp/invest since it is an alt coin. It is also recommended to short it when it reaches heavy resistance, in case that the general trend is now bearish and a manipulation pump happened reaching the heavy resistance, short is the best strong move.

zecusdt
👑 @F̲X̲o̲n̲e̲4̲a̲l̲l̲ 👑 VIP 🚀🚀
🟢 #ZEC- USDT 🔚BINANCE
💰 Buy now: 171.7
🔸TARGET 🎯
🔹 224.5
🔹260.5
🔹297.7
📝 RATIO: 10% Risk

ZEC/USDT (ZCash)ZEC/USDT chart showing major support and resistance levels / trendlines. Soon we will hit 300 USD Again imo :)

Zcash due for a decision this weekend or sooner.can't drift around at $215 - $230 forever
if it falls under the white horizontal. expect $200 -190
if it breaks up through the white diagonal, expect $300 quickly
EoY target remains $1,000 - assume Bitcoin reverses and prints new ATH in December also

ZECUSDT Breaking Support ZonesZECUSDT is in a downtrend held by 245.386.
201.238 is the target for a bias of 187.098
.
Khiwe
On this profile page, the shared analysis, ideas, and also, the strategy of a chart belong to Khiwe with some being influenced. The technical set-ups are speculative, they are not guaranteed for accuracy or completeness in the form of any content; it is not to advise on financial markets. Please apply your own analysis and confirm it with price action.

ZEC (Zcash) set to explodeZEC left the local triangle area now closing above the top descending trendline.
