short ZEC$ZEC broke through the ascending trendline and now is training below its local support level. Decline to 87$ is likely to happen.
ZECUST.P trade ideas

zecusdtHi my friends
In this new chart, I want to show you zec, which is likely to form a falling flag over a weekly time frame.
Which I have specified in the chart
And if my guess is correct, it could increase dramatically

ZECSince March 2020, the coin has gone from $17 to $370, which is more than 21 times.
The coin now looks bad, to put it mildly. The other day a triangle was formed, which if it breaks down, it will not be good for anyone. And it will break through, because the market is bearish.
The main supports:
The 90$ is already being tested and broken through, so there is strong weakness there.
The 50-70 zone is holding.
The fall was bought off at the upper line of this zone.
If it doesn't hold, too, we can go to the strong support line of $25.

Zcash shortZcash broke trough the ascending trendline. Asset broke trough the support level. Bearish movement to support level at 87 is possible.

Maybe OI goes higher and then Zcash ZEC price goes higher also"Privacy is the right to a free mind," Snowden said. "Without privacy, you can't have anything for yourself. Saying you don't care about privacy because you have nothing to hide is like saying you don't care about free speech because you have nothing to say."

ZCASH Can Become Bullish Even In This Bearish PatternIf We Observe ZCASH in Bigger Timeframes like Weekly, We can See That the Price Is in a Big Descending Triangle! So you Might Think to yourself that the Price is gonna Decrease,But there is a Bullish Sign as well! There is a Regular Bullish Divergence (+RD) On MACD which will Determine our Calculations. The Chance of being Bullish Is High So we can Safely Say that the price will Increase Soon & WILL break the Triangle. The Next Possible Resistance is around 280$.
-ZCASH is in a Big Descending Triangle (Weekly Timeframe)
-(+RD) On MACD will Change the Situation
-Price will become Bullish
-Resistance at 280$.

ZEC/USDT-1D-BINANCEThis is not a financial advice. Always do your own research and always put stoploss in your trade (SL) :) If you want more detailed info
how to study and read charts or just need help with some coin, just write to me here a comment, i will try to answer to everybody...
i can help you :) all for free, don't worry, BE HAPPY!
Zcash ZEC Entry Range, Price Targets and Stop LossZEC/USDT
Entry Range: $104 - 115
Price Target 1: $133
Price Target 2: $151
Price Target 3: $170
Stop Loss: $94
short targets reached

Zcash shortZcash bounced off the descending trendline. Asset bounced off the resistance area. Bearish movement to support level at 70 is expected to happen.

ZEC possible scenariohi traders ZEC breaked down trend and looks like zec pull backed to down trend and important istatic zone i expect this scenario for zec , comment blow your idea ...PEACE

ZECUSDT BUTTERFLY PATTERNButterfly
The Butterfly Pattern is a distinct 5-point extension structure that was discovered by Bryce Gilmore and further defined by Scott Carney. It has specific Fibonacci measurements for each point within its structure and it is important to note that D is not a point, but rather a zone in which price is likely to reverse, called the Potential Reversal Zone (PRZ). The B point retracement of the primary XA leg lies at 0.786 and the PRZ consists of 3 converging harmonic levels: 1) 1.27 extension of the primary XA leg, 2) AB=CD pattern, either equivalent or 1.27 and 3) Extreme BC projection of 2.00, 2.24 or 2.618.
The first target would be the 382 retracement of AD and the second target the 618 retracement of AD. Common stop levels lie behind the next structure level after the D point or the 1.41 extension of XA. Conservative traders look for additional confirmation.

Zcash longZcash broke trough the resistance area. Asset broke trough the descending trendline. Bullish movement to resistance level at 127.5 is possible.

ZECUSDT:Should You Long Me or Short Me?Hello Everyone, Today I am going to talk about ZECUSDT which got popular in previous days and went upto about 200USDT. But those who think ZECUSDT have a bright future they are wrong.
Let's get straight to the point ZECUSDT have formed head and shoulder pattern with neckline at 160USDT. If ZECUSDT start going up then you can do scalping till 150-155USDT. As the price might retest its neckline.
My idea about ZECUSDT is that we can wait upto 160USDT and then short it. But we have to remember about that it should be a true breakout. You have to check for a true breakout at 160USDT.
THANK YOU FOR GIVING ME YOUR PRECIOUS TIME.

ZEC - 1:7 Short📉⭐️ BTC bearish
⭐️ Trend is bearish
⭐️ Level is 8 days old
⭐️ 3rd touch
⭐️ When we touched the level, pulback was insignificant
⭐️ 46 ATR
⭐️ Under VWAP
Will enter when price squeezes to the level on lower timeframes, the base will form and the strip will get faster.
Fix profit by parts:
1% - 1/3
2% - 1/3, stoploss to breakeven
What's left, hold to the maximum
What do you think of this idea? What is your opinion? Share it in the comments📄🖌
If you like the idea, please give it a like. This is the best "Thank you!" for the author 😊
P.S. Always do your own analysis before a trade. Put a stop loss. Fix profit in parts. Withdraw profits in fiat and reward yourself and your loved ones


ZECUSDT wants the demand zone
The price got the liquidity from the daily resistance as I said in the previous video and now the price is going to create equal lows inside a previews range.
How to approach it?
If the price is going to have a breakout from the support, According to Plancton's strategy , we can set a nice order
–––––
Keep in mind.
🟣 Purple structure -> Monthly structure.
🔴 Red structure -> Weekly structure.
🔵 Blue structure -> Daily structure.
🟡 Yellow structure -> 4h structure.
–––––
Follow the Shrimp 🦐

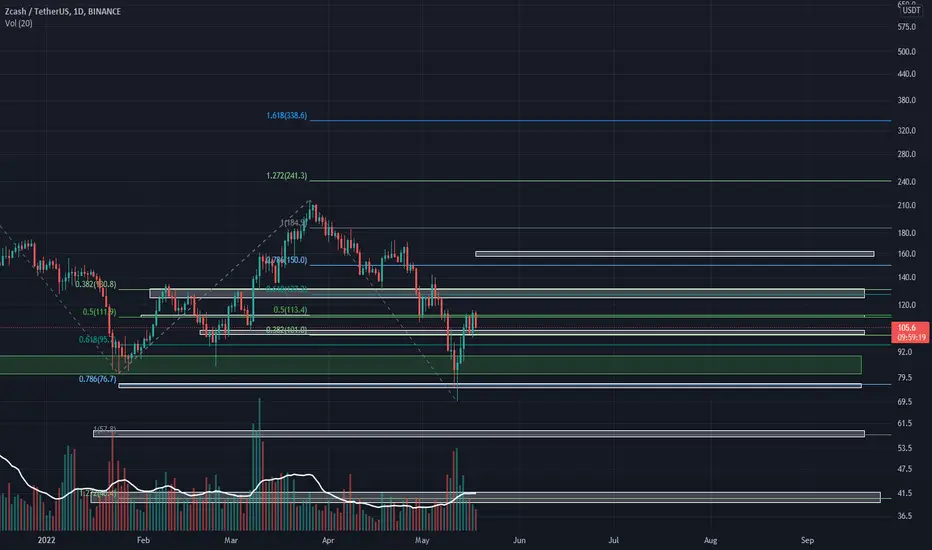
ZECUSDT wants to retest the monthly supportThe price lost the daily support and once is going to retest the 1.618 Fibonacci ext.
The price could create a bullish impulse until the 0.5, 0.618 Fibonacci level grab the liquidity in order and retest he monthly support on 85$
So, how we can approach it?
IF the price is going to have a breakout until the 0.5 - 0.618 Fibonacci level and the price is going to satisfy our rules, According to Plancton's strategy , we can set a nice order
–––––
Keep in mind.
🟣 Purple structure -> Monthly structure.
🔴 Red structure -> Weekly structure.
🔵 Blue structure -> Daily structure.
🟡 Yellow structure -> 4h structure.
–––––
Follow the Shrimp 🦐

ZEC MOON PATHZEC should break higher in June till then it will range between $120 - $190 and complete its accumulation structure. With the structure we currently in there is zero probability to the moon before June. ZEC will go above $1000 before September or October.


Shorting ZEC/USDTShort ZEC/USDT
Leverage x10
Entry: 123.97
Targets: 121.66(50%) - 117.96(25%) - 114.11(25%)
SL: 127.57
After hitting each target, move the SL to the previous one

Zec TASharing may TA, wait for break out or breakdown. Always put your confirmatory indicator. Take profit befor or with in the golden line and always put stop loss just in case of invalidation of my TA. RISK MANAGEMENT!! TAYOR not a financial advice!

Ztrash total collapse incoming100 followed by 50 and 25. Curb stomp this garbage. Trash belongs into the dumpster.

beginning of the uptrendingGiven that we are currently at the beginning of the uptrending, I likely continue in this way :
