ZRX has a great potential growth BTC is currently retracing dragging alts price lower, I've just switched my BTC left for ZRX because it seems to retrace much less compared to BTC. The chart pattern is promising as the project itself. If you looks the weekly it just raised a bit from the bottom so it should have a lot of room to go higher. Worst case scenario it retraces but much lower of those coins who pumped much more.
Most of entries were at 3640 sats so if you want a tight stop loss set it at that price. To enter anything below 3894 sats.
Let's wait a couple of days and see if I'm right!
ZRXBTC trade ideas


ZRX is ready for another leg, hold your hatsYOUR LIKE OR COMMENT IS MY FUEL FOR NEXT ANALYSIS :)
This is not a financial advice. Always do your own research and always put stoploss in your trade (SL) :) If you want more detailed info how to study and read charts or just need help with some coin, just write to me here a comment, i will try to answer to everybody... i can help you :) all for free, don't worry, BE HAPPY!
If u like the analysis, please feel free to ask any question about this TA or crypto or any coin - leave a comment or like or share the idea, i really appreciate it because then my work makes sense :) thanks!

Strong technique for growthsThe ZRX looks very strong which can make us test the last highs or even break them.
On the 4h chart, we are building a bullish trend reversal, you can see it on the RSI, a rebound from the level where the trend change took place earlier. The same is shown in the MACD, where in a few hours the trend may change from red to green. Everything looks pro-growth, even the fact that the corrective move was perfect from the 618 level

ZRX bull mode round two?We can see a falling wedge pattern so we can expect the breakout very soon. As always it depends on the BTC and its dominance.
Let's be prepared for the massive move. Good luck!


ZRX A Shark move | Upto 1000% rally expectedHi dear patrons, hope you are well and welcome to the new update on Ox (ZRX) token.
In 2019 I posted that the price action of ZRX completed a very big bullishg reversal Shark move on monthly chart. At that time the price action was likey to bounce from the support of a triangle therefore I suggested to by at 0.886 Fib level however the priceline completed the Shark and moved between 0.886 to 1.13 Fib level. And the price action rallied.
In the US Dollar market I posted this butterfly move that produced more than 1000% sofar.
But on the long-term monthly time period chart, the price action of the ZRX with Bitcoin pair was still moving in the potential reversal zone of Shark . The price action cannot enter in the negative zone, therefore I have placed the Fibonacci pattern up to 1.13 Fib level only for the educational purpose, however the price line has found the last support at 0.00001465 btc.
This trade has a huge profit possibility of 1050%, and the loss possibility is only 55.5%.
Note: Above idea is for educational purpose only. It is advised to diversify and strictly follow the stop loss, and don't get stuck with trade.

ZRX- 0X - LongZRX looks like its about to go ape. 100% vs BTC to start with.
this is a gap thats going to be filled.

Cup & handle patternAs you can see the classic cup and handle formation which is a good opportunity to buy.
Let's see how it plays out.
Good luck!

💡 ZRX: BUY Trade 🚀🚀🚀🚀🚀🚀Something going big in this project. huge buying going in ZRX. on every drop just buy it sell on target.

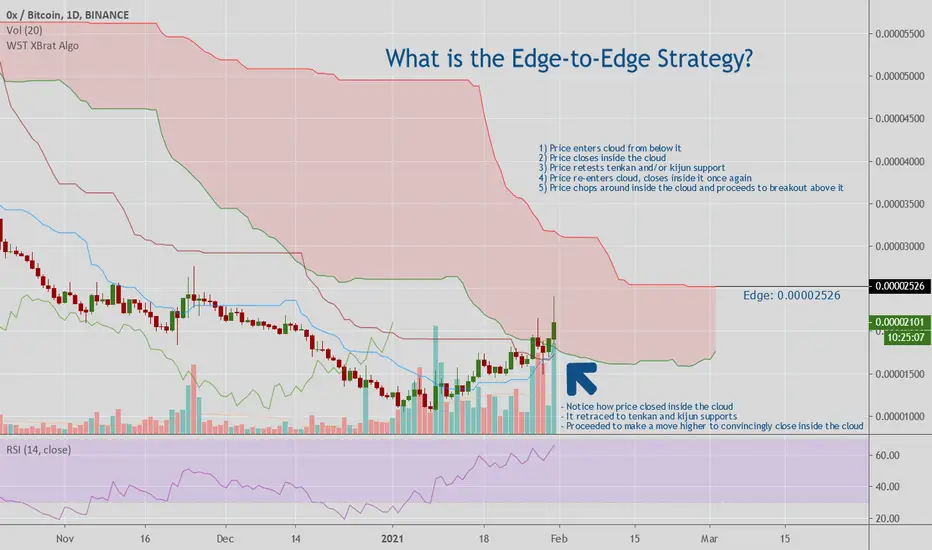
ZRX/BTC Ichimoku Cloud - Edge-To-Edge Strategy!The ZRX/BTC ichimoku cloud on the daily timeframe is undergoing an edge-to-edge move.
This strategy involves price moving into the cloud from below, and closing inside of the cloud. Once this happens, the edge-to-edge idea suggests price will make its way through the cloud to the other end for a 'kumo breakout' above the cloud.
Think of the cloud as an area of weak resistance/support. If you threw a rock at a real cloud, the rock would go right through that fluffy thing. Replace 'rock' with 'price' and you get the same idea here.

A Possible bullish move on ZRXBTCThere is a bullish divergence on 1W, coupled with the fact that it is currently sitting on a major support.
I am in for a long position.

LONG ZRXBTC Breaking a bad downtrend, going up !!! BTC is on a correction path, ZRX is on a upward path. Chinese year of the 0x is coming sooner then you think !

ZRXBTC StatusAfter rejecting from the historical ATL, I think ZRXBTC will move toward the higher resistance level.

#ZRX, UCTS 1D Buy signal confirmed as its crossing over ~1500#ZRX
UCTS 1D Buy signal confirmed as its crossing over ~1500 sats
Volume not looking that strong yet, but still the bot on @3commas took the trade (12%+ up atm)
cryptontez.medium.com
Looking for a R/S flip at current level OR stronger volume as signal of continuation
#ZRX

ZRX at an all-time low but hold your horsesZRX has recently set a new all-time low against Bitcoin. Last time this happened in September 2019 after months of sales against Bitcoin, which back then just ended a short-lived bull run.
Soon after that low, ZRX bounced up by +40% a week. So now many traders are curious if this setup would happen again.
We’ve asked the following question on the Cindicator platform:
The cryptocurrency 0x (ZRX/BTC) settled at 0.00001298 BTC at 10:25 AM UTC at the binance exchange on Monday, January 11. In your opinion, will ZRX/BTC trade above 0.00001623 BTC (+25.0%) at any time before January 25?
Hybrid Intelligence (148,000+ analysts +AI) voted, producing this result: 48.58%
This means uncertainty is very high.
There is about a 50% chance of ZRX going up +25% against BTC over next week.
Of course, there is the same chance of this NOT happening…
It’s best to avoid entering positions now and keep watching what BTC will do: a continued sell-off might drag ZRX even lower.

0x (ZRX) Moving Above EMA50 = BullishHere we have the chart for ZRXBTC (0x) which is now clearly leaning forwards the bulls.
In the past three days its price moved above EMA10, EMA21, and now EMA50.
Staying above EMA50 at 0.00001640 gives out a strong bullish signal... Prices can continue higher.
On a close daily below EMA50, support is next found at EMA10/21 or 0.00001390.
The indicators, MACD and RSI, also support a bullish move.
Namaste.

#ZRX, Looking for this long descending trendline to breakout #ZRX
Looking for this long descending trendline to breakout as signal of reversal
Volume also remaining weak but starting to show some activity(like the rest of the Alts market)
UCTS Buy signal could be a trigger for me as well
Upside looks promising
Set alerts and wait
#ZRX

#ZRX $ZRX BLOWOUT SALE!!!!This is just cheap, if you aren't filling at least a small bag that's garbage. Not financial advice


