SunnyHillCapital
EssentialThis price projection is taking into considering Fibonacci Extensions and projections as well as a well respected parallel channel and a fractal pattern from 2016. If the fractal pattern unfolds like it did back in 2016, we can expect Bitcoin to reach these price levels at the end of this year! It's going to be a massive bull run filled with FOMO, retail and...
Strong technical level for ETH to reverse providing us a once in a decade opportunity to buy ETH.
ETH/BTH has been on a heavy decline, this significant level marked by the parallel channel and Fibonacci level suggest a potential reversal zone. Time will tell. ETH/BTC is heavily oversold when you look at the RSI reading. Let me know what you think.
From a technical perspective, the recent reaction at the lower trendline of the parallel channel since 2016 has been respected many times, and once again, it has held. I anticipate that the price will explode in the next several months. We just need to be patient and wait for the Fed to pivot their monetary policy, and then cryptocurrencies will soar. Global...
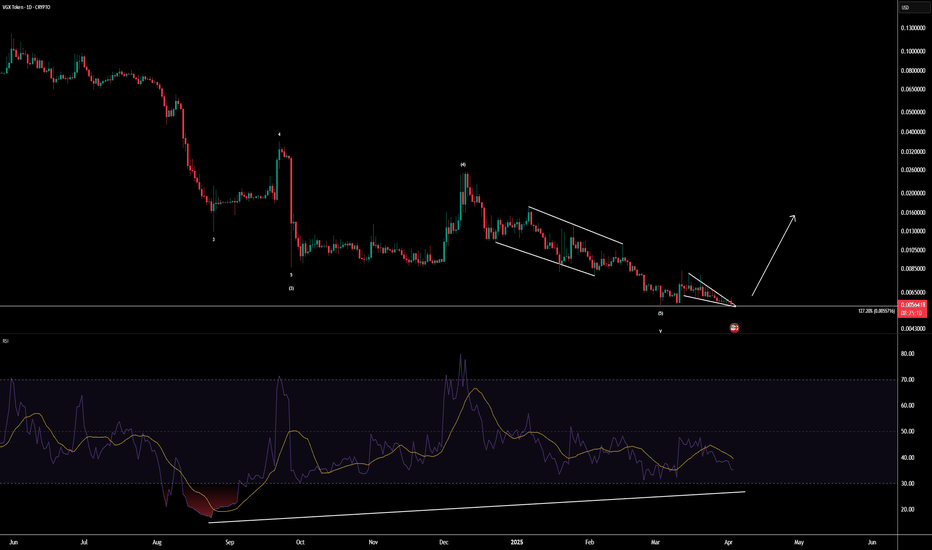
I'm expecting a reversal from VGXUSD, it offers an a healthy RRR to the upside. I don't think these low prices will hold for much longer, if you don't have VGX yet, better get some before it gets expensive. Let me know what you think. Best regards.
Looking down at the 1D timeframe, VGX is looking like it's ready for takeoff! I've done analysis on the 1M timeframe and now I'm just zooming into the micro level. Currently the price action has remained quite bullish and we may have found support, VGX has huge upside potential, if things go well, a few thousand percent. Let me know what you think. Best regards.
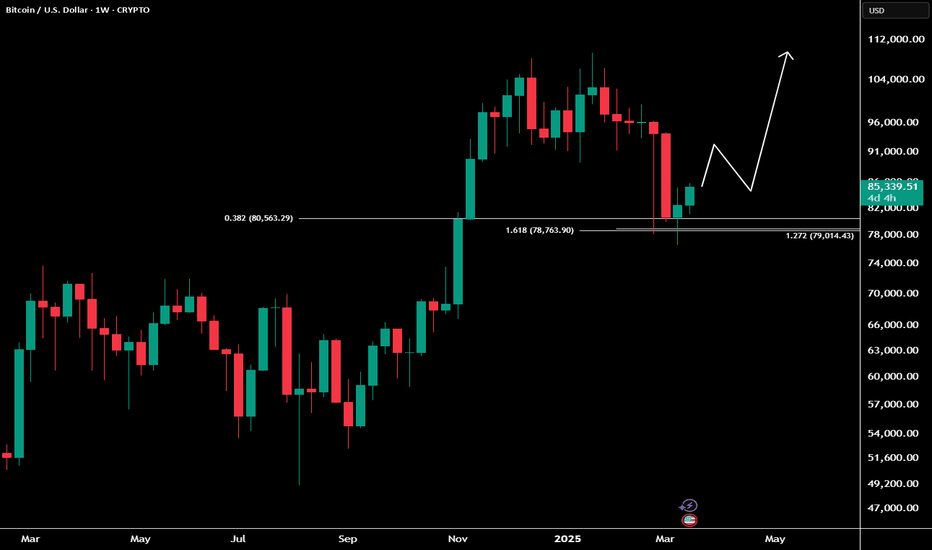
Bitcoin's bull run is not over yet, the price of BTC has reacted positively off at a strong level of Fibonacci confluence. My analysis suggests that we'll see a spike up, retracement back down and then blast off to push to make another all time high. Let me know what you think. Best regards.
We have an Elliott Wave count to support this idea, a confluence of Fibonacci levels as well as an extremely oversold and then the same could be said about the Bitcoin Dominance chart. From a technical perspective the Bitcoin Dominance chart also has a setup that adds a point of confluence for this reversal. Let me know what you think. Good luck!
ABCD patterns usually have a high probability in predicting reversal zones, right now ETH has completed this pattern. Expecting a reversal and the dawn of a bull market for ETH and Alt Coins. Let me know what you think. Good luck!
When we look at the monthly candle for Litecoin for Feb 2025, we have a bullish candlestick pattern, called the Dragonfly Doji. This candlestick pattern suggests that there are a lot more buyers that are able to withstand selling pressure. Additionally, to put the cherry on top, it just so happens that the wick of the Dragonfly Doji retraced to a gap of the Nov...
Based on this Elliott Wave Count on the Others.D chart, it suggests that Wave (IV) has completed and by extension means that Alt Coin Season is here! Technical confluences at this level: Monthly 100 Day EMA 23.6% Monthly Fibonacci Level 61.8% Fibonacci Projection Level Parallel channel that forecasts the completion of Wave (IV) There are 2 targets, 25%...
This is it! As long as the price of ETH remains above 2127.94, this count is valid. There is a clear completion of Wave (5) of c of (II). This is an extremely attractive level for buyers for the long-term. There is an extreme level of fear in the Crypto market right now, this is the time to go against the market, this is where you make the most gains. I'm more...
A simple Wave (I) & (II), next I'm expecting buyers to come in here and take the price of ETH to ATH. This increased level of volatility is a good sign and it should be mirrored to the upside in the short-term. Let me know what you think, is this the reversal zone or is ETH heading past the invalidation point? Good luck!
Simple chart pattern suggest that we can expect Alt Coins to have a bullish move. Based on this Cup & Handle target, the Alt Coin market will have a market cap of 1.94 Trillion, a +600% increase from its current 263 million market cap. Let me know what you think. Good luck!
As long as price remains above 0.000042400, this pattern remains valid. Let me know what you think. Good luck!
As noted on the chart: Extremely strong Trendline, Fib levels, and Monthly 55 EMA support. Triangle formation suggests that an explosive breakout is expected. Price is expected to breakout from here. Move to all time high is feasible. Let me know what you think. Good luck!
XRP's move has been solid indeed. However, I'm anticipating that ETH is now going to outperform XRP in the coming months. Based on this EW count it suggests that we've completed a nice correction against the primary trend and we can expect XRP/ETH to have a sharp correction back to the downside. Let me know what you think. Good luck!
This Elliott Wave count is clear and simple, it's a large corrective Zigzag pattern (5-3-5) which is likely that it's already complete due to the large monthly candle of Nov 2024 and the break of previous market structure highs and channel. This setup also lines up with my other idea that we're now entering the dawn of Alt Season due to the Elliott Wave count...


