VIAQUANT
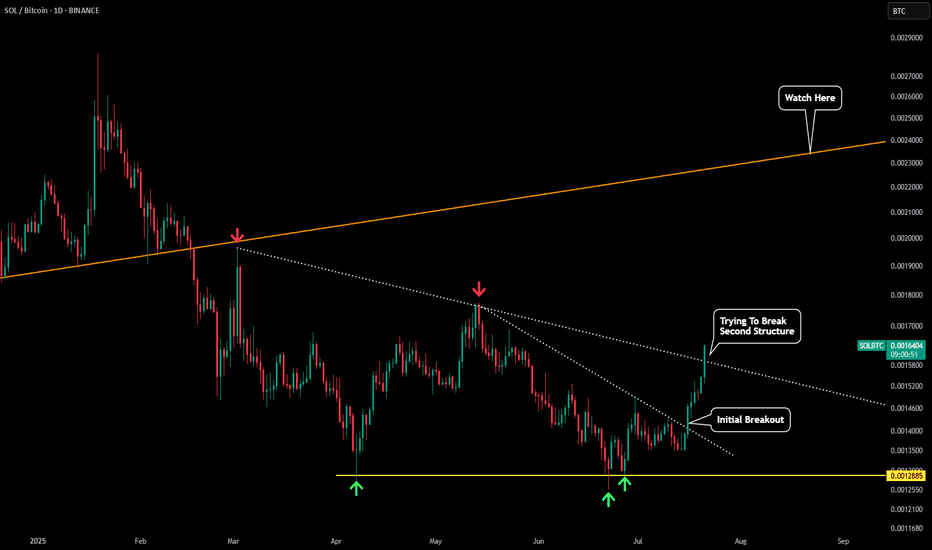
PlusSol finally catching up to the recent momentum we have seen with other crypto assets such as BTC, ETH, and XRP. Looking at the SOLBTC chart we can see that we are trying to breakout of the second resistance structure. As long as price does not close the daily below this trendline then it should act as a new level of support. The orange trendline at the top will...
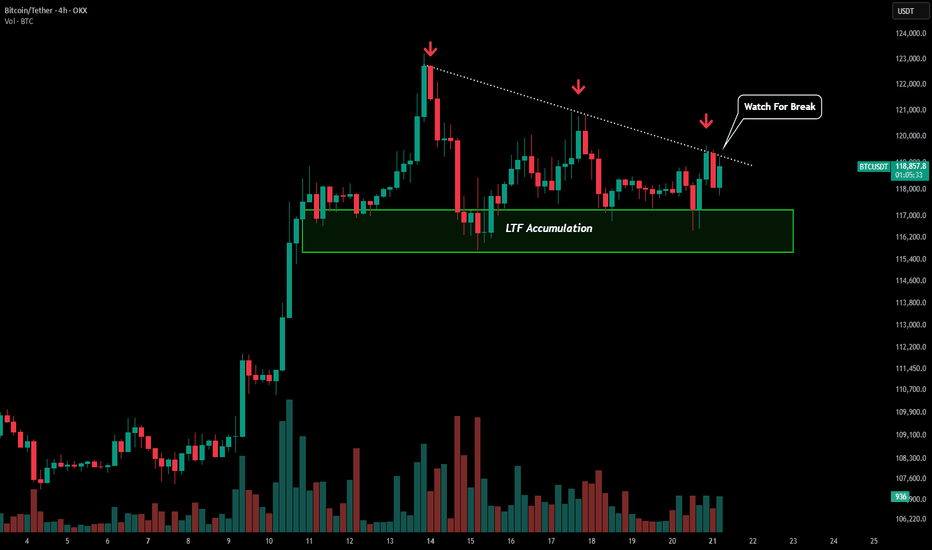
In our previous posts we were outlining the levels for a potential BTC pullback, but after some price development in this region it may be signaling a different story. Since our high of $123k we have been forming a downwards sloping trendline of sell pressure (dotted white line). At the same time we have seen bulls continue to buy up the dips in our green box....
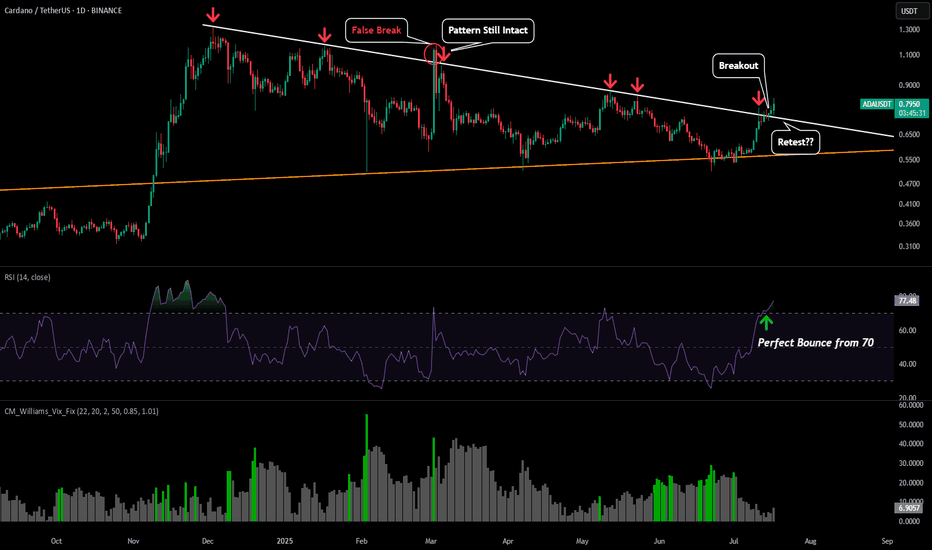
We have already seen ADA breakout of its symmetrical triangle, but if BTC does have a downswing we could see ADA retest the triangle as support to provide entries. Retest would most likely align somewhere between $0.72-$0.74. However the 1D RSI is showing tremendous strength with the bounce from the 70 level, so if there is no retest and price continues to...
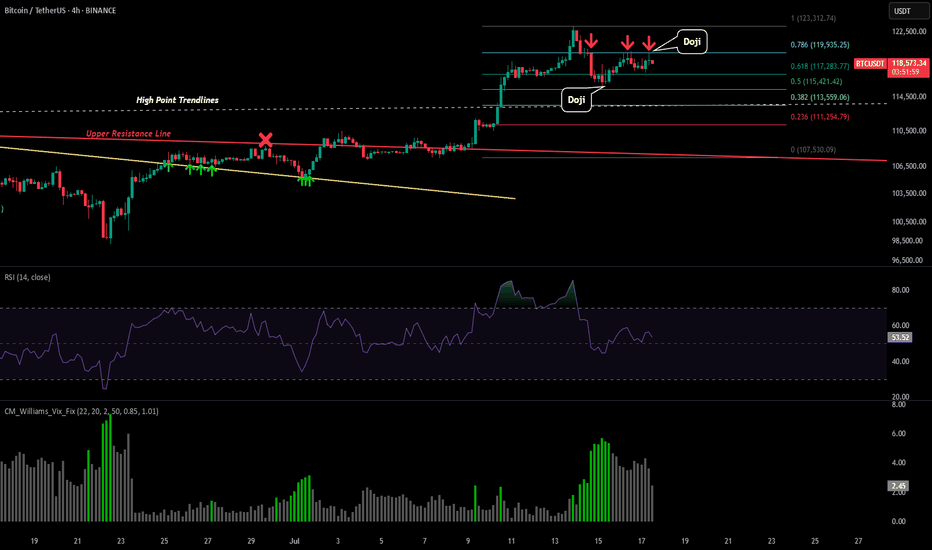
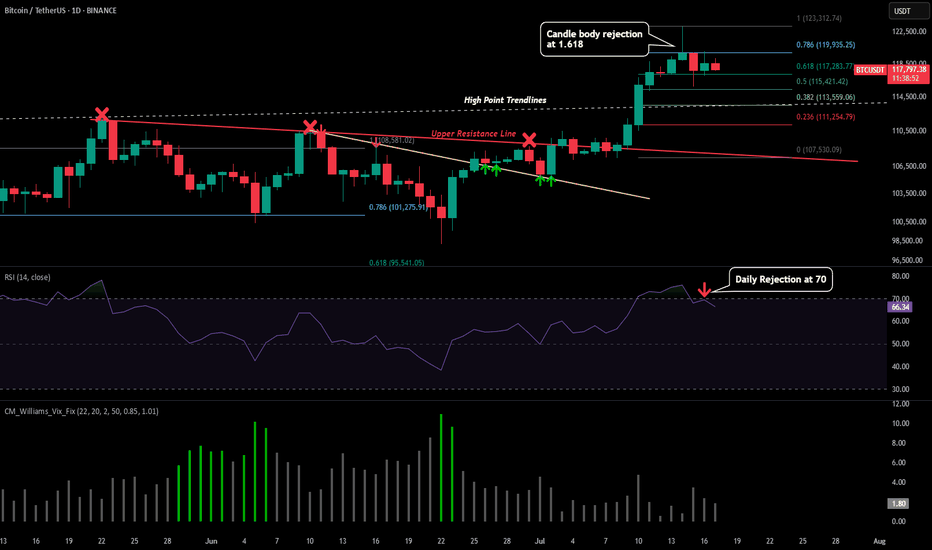
Please refer to our previous post: If you look at the predictive fib model we presented in our last post, we are starting to get more accurate developments. Today we just saw another rejection at our 0.786 predictive fib level with a potential reversal doji. That is now 3 touchpoints of resistance right around $120k (which is also inline with the 1.618...
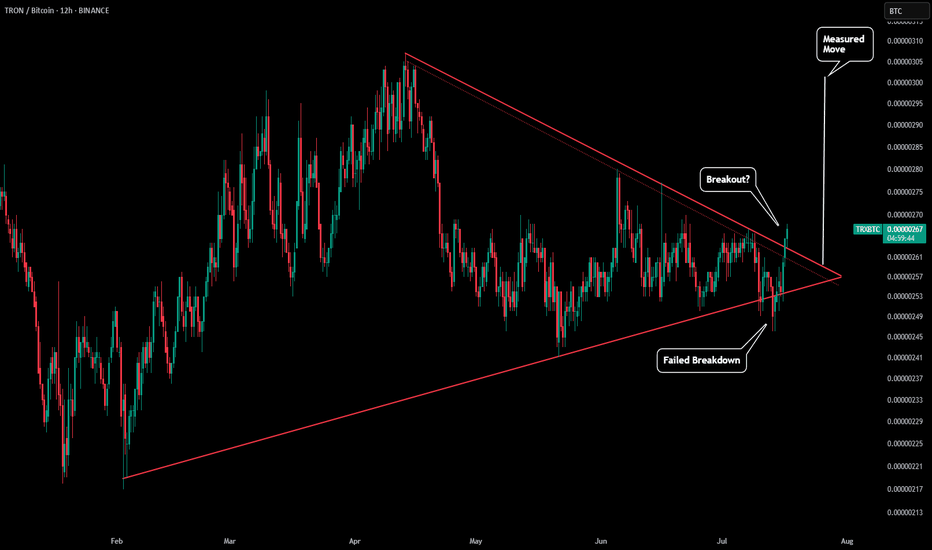
We have already seen the TRX/USD chart breakout (as seen in our previous post), but now the BTC pair is trying to breakout to. On the daily chart we are trying to get above our downwards sloping red resistance line. It is possible we retest, but if this breakout continue that could push the BTC pair to above $0.000003 +. This is inline with our measured move...
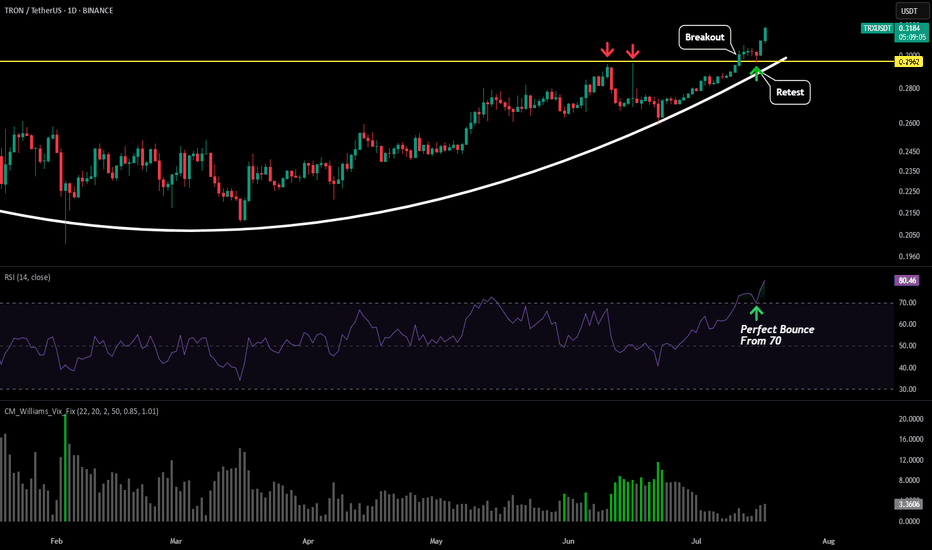
Recently TRX brokeout from its resistance level (yellow line) and is skyrocketing to the upside. The technical move for this move is $0.43-$0.45. Last time we were around these price levels we saw an almost 100% daily candle so it could shoot up there really quickly. A break back below the yellow line and this because a failed breakout, but right now things look...
We have seen a liquidity zone form for the past year and finally we are looking at a successful retest. Given this holds as a new buying zone then our next target would be $170-$174 followed by the ATH around $216. If price fails to hold this liquidity zone as new support and price closes back below $154 then this would be a failed breakout.
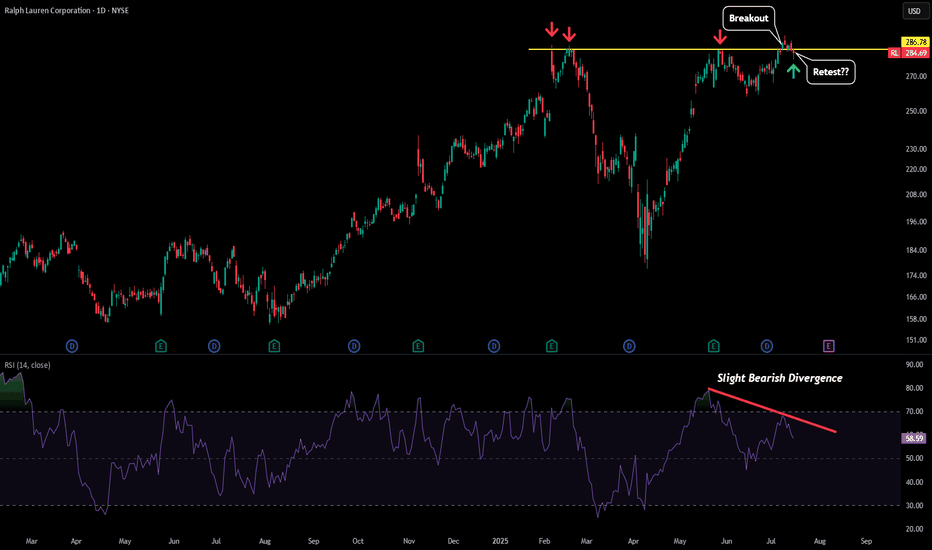
Ralph Lauren is trying to breakout above the highs. So far we have seen a breach of the key $286-287 level and currently price is in the process of retesting that level as potential new support. Its to early to say right now as this could end up being a failed breakout as the RSI has a slight bearish divergence. But if we see price start to rise back above that...
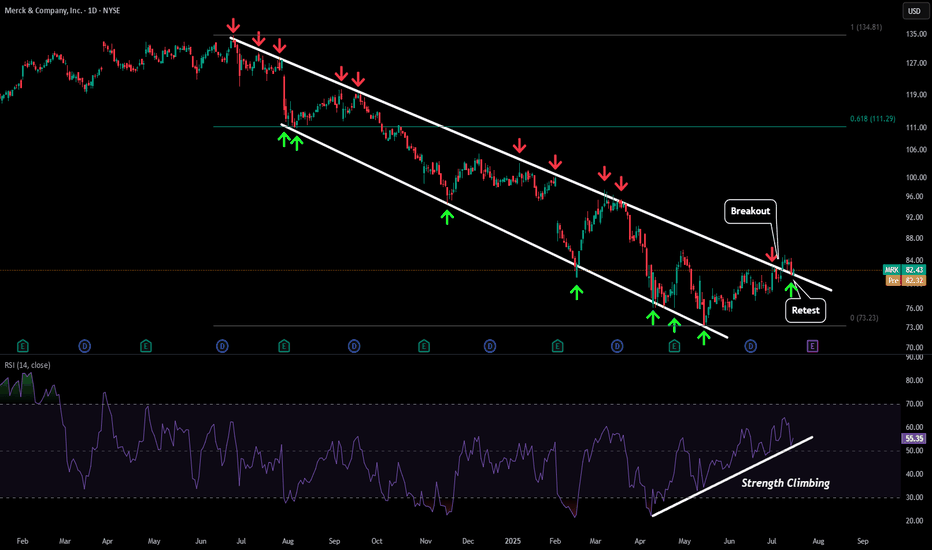
After being in a downtrend for almost a year things finally look like they are starting to turn around for MRK. Recently price broke the downwards sloping resistance and has retested that level as a new support level. We have also seen strength increasing on our daily RSI bringing some life back into this stock. Our first price target to the upside would be...
Please refer to our previous post: To give additional detailed context of what to look for please look at our last post that is linked above. So far with recent price developments this idea is still intact. What I have also outlined in todays post are some of the reason this short term retracement is still in place. -Market has moved up very fast -Lots of...
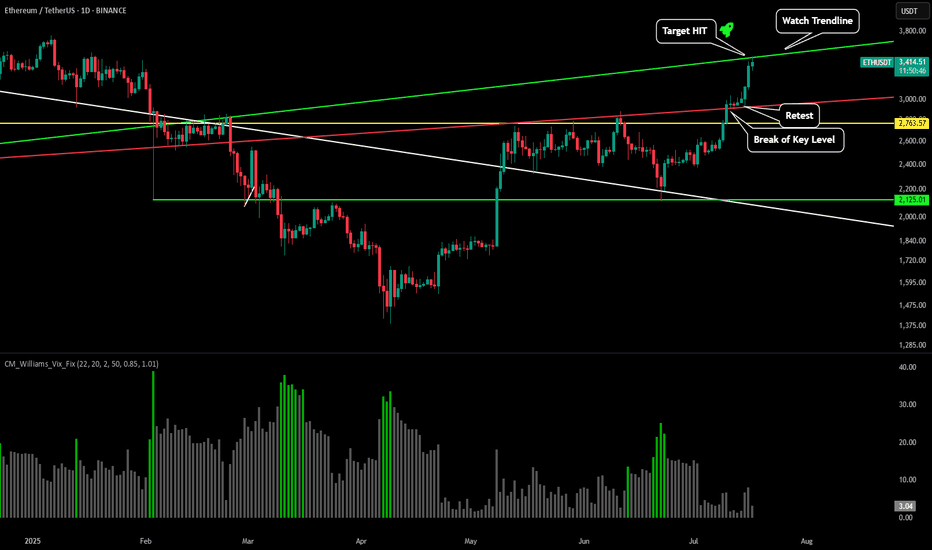
Please refer to our previous post: As stated here after breaking our red key trendline our prediction was price would move up swiftly to test the green trendline between between $3,400-$3,500. After a successful retest of the red trendline it only took price 48 hours to increase 19% and reach our green trendline. This is a major area where we could see some...
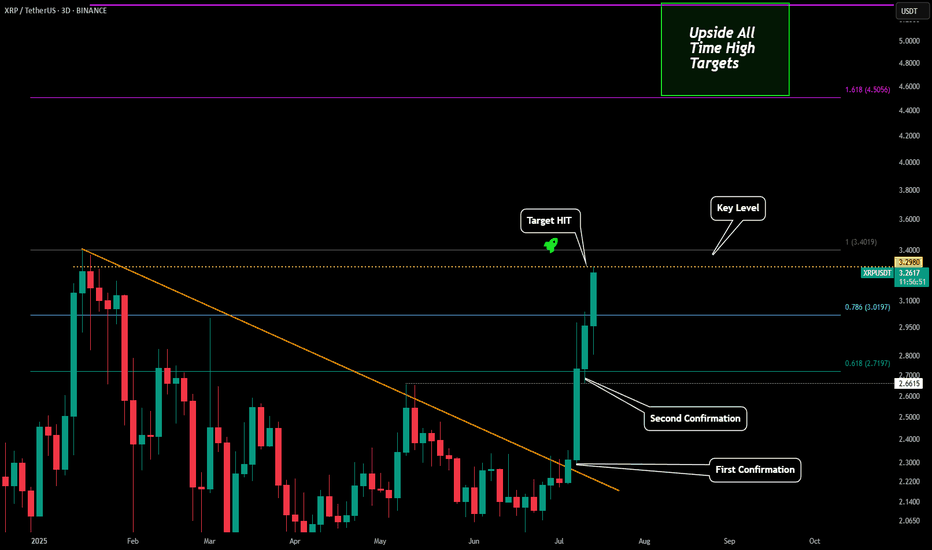
Please refer to our previous posts: As stated in the last post our breakout target level (key level) was just hit. A 44% breakout move just occurred over the past 10 days due to the amazing analytics of the Viaquant system. Now it is possible we see some profit taking in this region, but as soon as the last high is breached I have also outlined where to...
Currently Meta's double top around $750 is still in play. We wanted to watch the $710 level start to hold to climb back up but in early market we are still seeing a fall which could lead to our next lower support level around $680. EPS data coming at the end of the month could signal if the trend will continue to be weak or if it is able to stay in line with the...
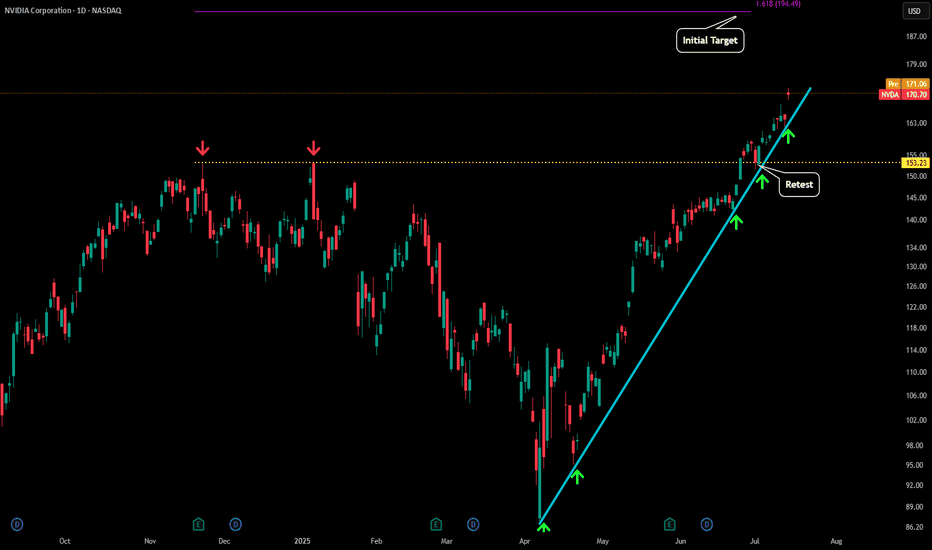
NVDA has continue to see our near vertical trajectory to the upside. After yesterday's test of our blue trendline on the daily at $160 price bounced and has now moved up to $170. Due to the angle of this trend we will break to the downside very soon, but most likely not before some sort of blow off top move towards the $200 level. It is possible we continue to...
Please refer to our previous post: After identifying our first target right around $120.4k we are seeing the first signs of a cooloff. Until we get a daily candle close above this level price is likely to flush some leverage. The main move to $140k area is still likely to happen, but if we see a retracement in the short term here are the LTF levels to...
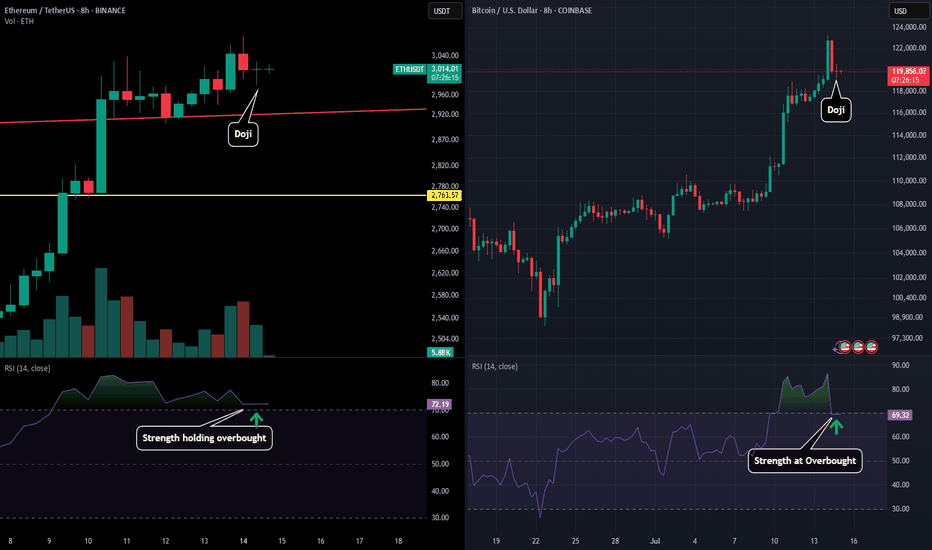
We have seen a very important development on the 8H chart for both BTC and ETH. Both assets after seeing a selloff through the day then found some LTF support and ending up printing reversal dojis on the 8H. Apart from the doji printing both assets are at extremely important levels for the RSI. ETH is slight above overbought conditions meaning if we can see...
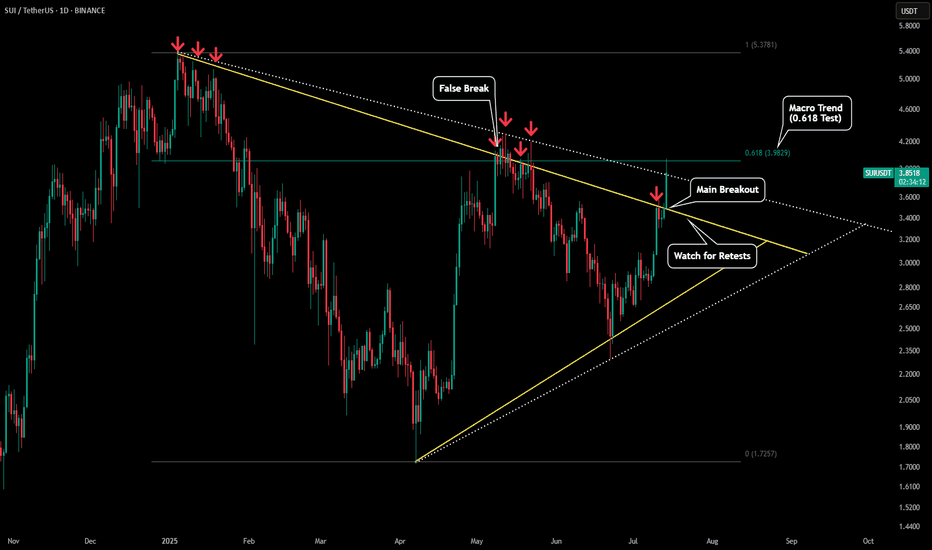
This chart is in expansion to our previous post: What we can see is SUI has clearly broken out of its symmetrical triangle (yellow trendlines). This is the first good sign for potential new highs for SUI. However since the 4H chart could be spelling out a short term drop lets see where price could go. Right now it is testing the 0.618 of the macro trend as...
Right now the market is extremely hot as BTC is skyrocketing to the upside. However we are beginning to reach levels where a short term pullback could be on the table to flush out overleverage. Therefore, if a pullback does occur then these are the levels to watch. For SUI we are seeing very early signs of a short term reversal occurring. The first bearish...
