game_of_charts
Two channel and some blue resistance and support for weekly chart was enough to figure that out.
The yellow level is broken and now we can act on it for a long
It really doesn't need any explanation
34500 tether is an important resistance for bitcoin and I expect to go down from There. The next supporting area for bitcoin is 27000 tether.
Sorry I Don't have time to explain
After breaking the yellow level it can go up to the yellow line that is a strong resistance
There is a strong uptrend and after a little playing (!) It's time to continue its past direction for a while !
After breaking the yellow level is I think it will continue its uptrend and I believe it's going upper than the previous high
It has had a strong uptrend. It is now at a level that has been attractive to buyers.
It's in the good support line and after a little playing in that area It can go to the next resistance
Now the yellow level is a resistance It has tested again And now it will go down to the next important support We have find the next support with the help of the channel
After re-testing the important resistance, I think it will continue its downward path
The black resistance line is an important line and I expect it to be tested again ...
After retesting the major resistance line , It is only logical to look for short
Strong resistance and downward movement ... I think we should look for Short
I think the chart is talking ...
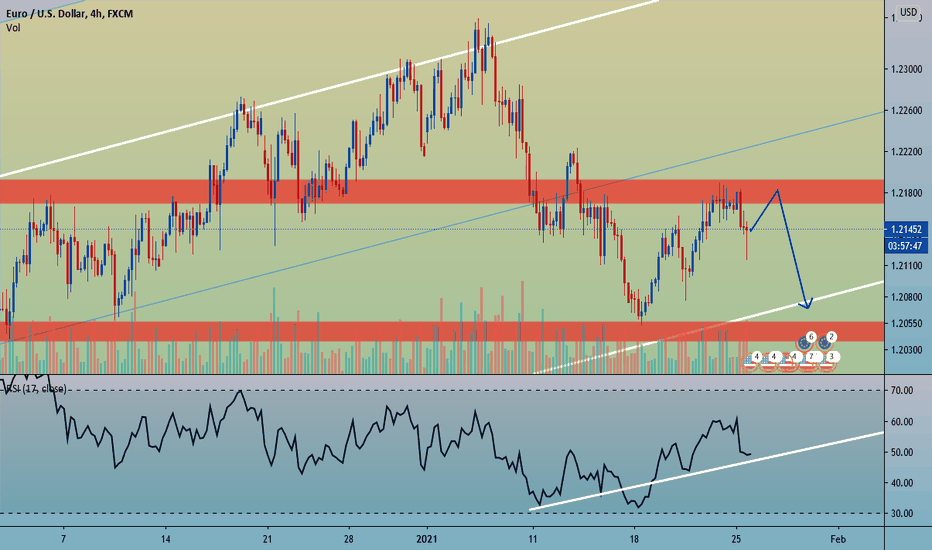
This is what I think about EURUSD for the next step


