
Trump’s Comments Spark Rally in Cannabis StocksTrump’s Comments Spark Rally in Cannabis Stocks
Shares of cannabis-related companies have surged sharply in recent days, as what had previously been market rumours received official confirmation.
According to media reports:
→ The US President confirmed his intention to reclassify cannabis as a Schedule III substance, which would designate it as less dangerous. Such a move could boost funding for the cannabis industry and related scientific research, while also easing criminal penalties. “We are looking at this very carefully,” Trump told reporters in the Oval Office.
→ The White House’s decision to reclassify cannabis would also remove the impact of Section 280E of the US tax code, which has limited profitability for companies in the cannabis sector.
Among the top gainers was shares of Canadian firm Cronos (CRON), which climbed to its highest level since late 2022 yesterday.
Technical Analysis of CRON Shares
Technical analysis shows that in the second half of 2025, CRON shares have been trending higher, forming an ascending channel. Within this structure:
→ the channel median acted as resistance between 9 and 11 December before being broken by strong buying pressure;
→ yesterday, CRON formed a bearish candle after several days of gains;
→ the high of that candle is close to the upper boundary of the channel;
→ the RSI is moving lower after peaking above the 80 level.
Trump’s remarks may have triggered a wave of speculative buying, but the decision has not yet been formally signed. As a result, buyers of CRON shares (and other cannabis stocks) may be at risk of being caught in a trap. As emotions fade, CRON’s share price could drift back towards the channel median, where supply and demand tend to rebalance.
This article represents the opinion of the Companies operating under the FXOpen brand only. It is not to be construed as an offer, solicitation, or recommendation with respect to products and services provided by the Companies operating under the FXOpen brand, nor is it to be considered financial advice.
FXOpen publications
FXOpen publications

EUR/NZD Pulls Back From Its December HighEUR/NZD Pulls Back From Its December High
Today the EUR/NZD rate touched the 2.4000 level — the highest reading since late November — but then saw a fairly sharp pullback. Fundamentally, the heightened volatility is driven by a combination of factors.
The euro (EUR) is showing strength because:
→ industrial production in the euro area unexpectedly rose by 0.8% (above forecasts), easing recession fears;
→ the market expects a more measured tone from the European Central Bank amid stabilising data. The meeting will take place on Thursday, 18 December.
On the other hand, the New Zealand dollar (NZD) has come under pressure:
→ a report published on 9 December by the New Zealand Treasury (the Half Year Economic and Fiscal Update) delivered a gloomy outlook: the economic recovery is stalling, and unemployment could rise to 5.5%;
→ prices for dairy products (the country’s main export) are falling, undermining the resilience of the “kiwi”.
That said, the EUR/NZD chart suggests that the scope for further upside may be limited.
Technical Analysis of the EUR/NZD Chart
From 29 November to 12 December, the pair declined (A→B) by roughly 2.9%, and then rallied to today’s peak (2), which lies almost exactly midway between the extremes at A and B. From a Fibonacci perspective, this can reasonably be interpreted as a normal pullback to the 50% level, after which the downward move may resume.
From the viewpoint of trend channels, the descending channel has been expanded upwards, while today’s move (up then down) essentially resembles a Bearish Engulfing pattern — formed during an attempt to break above the upper boundary of the channel.
Many indicators are likely to show divergence between highs 1 and 2. Therefore, taking all of the above into account, forex traders should keep in mind a scenario in which the upward trajectory of the past seven days (shown in blue) is broken by the bears, and the EUR/NZD rate continues to develop within the descending channel.
This article represents the opinion of the Companies operating under the FXOpen brand only. It is not to be construed as an offer, solicitation, or recommendation with respect to products and services provided by the Companies operating under the FXOpen brand, nor is it to be considered financial advice.

Market Insights with Gary Thomson: 15 - 19 DecemberMarket Insights with Gary Thomson: UK Jobs, US NFP & CPI, and BoJ Rate Call You Can’t Ignore
In this video, we’ll explore the key economic events and market trends, shaping the financial landscape. Get ready for insights into financial markets to help you navigate the week ahead. Let’s dive in!
In this episode of Market Insights, Gary Thomson unpacks the strategic implications of the week’s most critical events driving global markets.
👉 Key topics covered in this episode:
— UK Unemployment Rate
— US Nonfarm Payrolls and Unemployment Rate
— US Inflation Rate
— BoJ Interest Rate Decision
Gain insights to strengthen your trading knowledge.
Disclaimer: This video represents the opinion of the Companies operating under the FXOpen brand only. It is not to be construed as an offer, solicitation, or recommendation with respect to products and services provided by the Companies operating under the FXOpen brand, nor is it to be considered financial advice.

S&P 500 Index: Chart Analysis After Friday’s Sell-OffS&P 500 Index: Chart Analysis After Friday’s Sell-Off
Trading on 12 December was overshadowed by a sharp decline in the S&P 500, with the session low approaching December’s previous trough.
Among the key fundamental drivers behind Friday’s drop was the market reaction to Broadcom’s quarterly report. Shares (AVGO) plunged more than 10%, possibly as investors aggressively took profits in tech stocks, concerned that the AI hype may be overheated.
A review of the 4-hour chart of the S&P 500 suggests that Friday’s negative sentiment may have begun to ease, as the index is now recovering. Overall, this presents an interesting picture from a price-action perspective.
Technical Analysis of the S&P 500 Chart
Five days ago, we noted that an ascending channel had formed in early December, which could be interpreted as cautious optimism ahead of key news.
However, Fed-related announcements triggered a surge in volatility (as we described, “the calm before the storm”), pushing prices beyond both boundaries of the blue channel:
→ The failure to hold above the upper boundary can be seen as bulls lacking confidence to challenge the all-time high. The false break around 6929 looks like a trader trap.
→ Conversely, bears may have been unable to suppress buying near Friday’s low, as indicated by the long lower wicks on the candles (highlighted by the arrow).
The chart now shows a complex Megaphone pattern (marked A–F).
It is possible that the coming week will be characterised by consolidation following Wednesday–Friday’s swings, with market sentiment increasingly influenced by the approaching holiday period.
This article represents the opinion of the Companies operating under the FXOpen brand only. It is not to be construed as an offer, solicitation, or recommendation with respect to products and services provided by the Companies operating under the FXOpen brand, nor is it to be considered financial advice.

USD/JPY Slides Towards Key SupportUSD/JPY Slides Towards Key Support
A Bank of Japan monetary policy meeting is due this week, and expectations around the decision are supporting the yen today. Traders increasingly believe that the central bank may raise its policy rate by 25 basis points to 0.75%.
Moreover, according to Trading Economics, analysts expect the interest rate to reach 1% by July 2026. Senior officials in Prime Minister Sanae Takaichi’s cabinet are also unlikely to oppose tighter policy, as an excessively weak yen could drive up import costs and fuel inflation.
Technical Analysis of the USD/JPY Chart
The chart shows USD/JPY moving lower today towards the important support level at ¥155 per dollar. Earlier this month, bears attempted to break below this level but failed to gain leading momentum.
Notably, market fluctuations since October have formed an ascending channel. Within this framework:
→ the channel median has twice acted as resistance, a bearish signal;
→ the price is currently near the lower boundary of the channel, which may serve as strong support.
Given these factors, it is reasonable to assume that expectations of tighter monetary policy could lead to a break below the combined support formed by the lower channel boundary and the key 155.00 level. If this occurs, the area could turn into resistance, opening the way for USD/JPY to move towards the next major support near ¥150 per dollar.
This article represents the opinion of the Companies operating under the FXOpen brand only. It is not to be construed as an offer, solicitation, or recommendation with respect to products and services provided by the Companies operating under the FXOpen brand, nor is it to be considered financial advice.

Market Analysis: NZD/USD Test Support, Break or Bounce Next?Market Analysis: NZD/USD Test Support, Break or Bounce Next?
NZD/USD is consolidating and could aim for a move above 0.5800 in the short term.
Important Takeaways for NZD/USD Analysis Today
- NZD/USD is consolidating above 0.5765 and 0.5755.
- There is a major bullish trend line forming with support at 0.5765 on the hourly chart of NZD/USD.
NZD/USD Technical Analysis
On the hourly chart of NZD/USD, the pair also followed AUD/USD. The New Zealand Dollar failed to stay above 0.5800 and corrected gains against the US Dollar.
The pair dipped below 0.5790 and the 50-hour simple moving average and 0.5830. A low was formed at 0.5765, and the pair is now consolidating below the 23.6% Fib retracement level of the downward move from the 0.5831 swing high to the 0.5765 low.
The NZD/USD chart suggests that the RSI is below 40, signaling a short-term negative bias. On the upside, the pair is facing resistance near the 50% Fib retracement level at 0.5800.
The next major hurdle for buyers could be 0.5815. A clear move above 0.5815 might even push the pair toward 0.5830. Any more gains might clear the path for a move toward the 0.5880 pivot zone in the coming sessions.
On the downside, there is support forming near the 0.5765 zone and a bullish trend line. If there is a downside break below 0.5765, the pair might slide toward 0.5740. Any more losses could lead NZD/USD into a bearish zone to 0.5710.
This article represents the opinion of the Companies operating under the FXOpen brand only. It is not to be construed as an offer, solicitation, or recommendation with respect to products and services provided by the Companies operating under the FXOpen brand, nor is it to be considered financial advice.

Market Analysis: AUD/USD Test Support, Break or Bounce Next?Market Analysis: AUD/USD Test Support, Break or Bounce Next?
AUD/USD is attempting a fresh increase from 0.6630.
Important Takeaways for AUD/USD Analysis Today
- The Aussie Dollar started a minor pullback from 0.6685 against the US Dollar.
- There is a key bullish trend line forming with support at 0.6645 on the hourly chart of AUD/USD.
AUD/USD Technical Analysis
On the hourly chart of AUD/USD, the pair formed a base above 0.6600. The Aussie Dollar started a decent increase above 0.6630 against the US Dollar to enter a short-term positive zone.
The pair struggled above 0.6680 and recently corrected some gains. The recent low was formed at 0.6632. The pair is now consolidating and facing resistance near the 50% Fib retracement level of the downward move from the 0.6677 swing high to the 0.6632 low at 0.6655 and the 50-hour simple moving average.
The AUD/USD chart indicates that the pair could struggle to clear the 76.4% Fib retracement at 0.6665. The first major hurdle for the bulls could be 0.6685.
An upside break above 0.6685 resistance might send the pair further higher. The next major target is near the 0.6720 level. Any more gains could clear the path for a move toward 0.6750. If there is no close above 0.6665, the pair might start a fresh decline.
Immediate bid zone could be near the 0.6645 level. There is also a key bullish trend line forming with support at 0.6645. The next area of interest is 0.6630. If there is a downside break below 0.6630, the pair could extend its decline toward 0.6600. Any more losses might signal a move toward 0.6570.
This article represents the opinion of the Companies operating under the FXOpen brand only. It is not to be construed as an offer, solicitation, or recommendation with respect to products and services provided by the Companies operating under the FXOpen brand, nor is it to be considered financial advice.

XBR/USD Chart Analysis: Price Rebounds from a Seven-Week LowXBR/USD Chart Analysis: Price Rebounds from a Seven-Week Low
On 1 December, we outlined a descending channel on the XBR/USD chart and noted that the bearish trend was driven by fading geopolitical risks. Indeed, hopes for an end to the war in Ukraine—along with the possibility of sanctions on Russia being eased—acted as a bearish catalyst.
In addition, the International Energy Agency reaffirmed its forecast for a record supply surplus and highlighted that global inventories have reached a four-year high.
Under the influence of these and other factors, such as signs of a slowdown in the Chinese economy, Brent crude fell to a seven-week low at point A. However, today the XBR/USD chart shows a bullish reversal, again triggered by geopolitics, according to media reports:
→ The United States has intercepted a sanctioned Venezuelan tanker, which Caracas described as an “act of piracy”.
→ Ukraine has struck another vessel from the “shadow fleet” linked to Russia’s oil trade.
Technical Analysis of XBR/USD
From a bearish perspective:
→ the $62.60 level (where the blue trendline was broken) remains a significant resistance zone;
→ bulls failed to preserve the gains from the A→B rally, as the price sank further to the low at point C;
→ the nearest resistance lies around $61.70.
From a bullish perspective:
→ the lower boundary of the channel may continue to act as support;
→ Brent crude has rebounded convincingly after a false bearish break below the November low—an indication of a potential liquidity grab, suggesting that “smart money” may be siding with demand.
Given these factors, geopolitical tensions may intensify, potentially driving XBR/USD back towards the median of the descending channel.
This article represents the opinion of the Companies operating under the FXOpen brand only. It is not to be construed as an offer, solicitation, or recommendation with respect to products and services provided by the Companies operating under the FXOpen brand, nor is it to be considered financial advice.

Silver Price Hits Historic Record Around $64Silver Price Hits Historic Record Around $64
On 27 November, we suggested that silver was preparing to challenge its all-time high. Since then (marked with the orange arrow), XAG/USD has risen by roughly 18%, breaking above the psychological $60-per-ounce threshold for the first time in history.
The rally has been driven by strong retail inflows into silver ETFs, alongside expectations of a structural supply deficit by 2026 due to robust industrial demand—particularly from solar energy, electric vehicles, and data-centre infrastructure.
The weakening of the US dollar following the Federal Reserve’s decision on Wednesday also helped lift dollar-denominated silver to a new historic peak near $64.
Technical Analysis of XAG/USD
A review of the XAG/USD chart shows that the price has been moving within a rising channel that encapsulates the uptrend beginning in early September.
Within this structure:
→ the channel median acted as a springboard for price growth on 4 December;
→ the line dividing the upper half of the channel into quarters switched from resistance (earlier in the month) to support on 10 December;
→ silver is now trading near the channel’s upper boundary, which may behave as significant resistance (as it did in mid-October).
Given these factors, the market may now be heavily overheated, leaving it vulnerable to a correction. Should this scenario begin to unfold, we could see a bearish break of the steep upward trajectory that has lifted silver by around 30% from the 21 November low.
This article represents the opinion of the Companies operating under the FXOpen brand only. It is not to be construed as an offer, solicitation, or recommendation with respect to products and services provided by the Companies operating under the FXOpen brand, nor is it to be considered financial advice.

Dollar Index Chart Analysis After the Fed DecisionDollar Index Chart Analysis After the Fed Decision
Following yesterday’s FOMC interest rate decision and Jerome Powell’s press conference, the US Dollar Index (DXY) dropped sharply to point A.
On one hand, the 0.25% rate cut makes the dollar less attractive for capital preservation and yield. On the other, the prospect of a pause before further cuts provides some support.
Thus, the current level represents the market’s attempt to establish a fair valuation for the US currency.
Technical Analysis of the DXY Chart
Three days ago, we:
→ updated the system of two trend channels;
→ noted signs of seller dominance;
→ highlighted the formation of a consolidation zone.
Yesterday’s decline prompted an extension of the blue upward channel formed in October–November. Key insights from recent price action include:
→ the consolidation zone (marked by black lines) was broken after the median of the red channel acted as resistance (indicated by the arrow);
→ the price fell to the lower boundary of the red channel;
→ the former support around 98.78 acted as resistance this morning (marked by the second arrow);
→ the RSI indicator is near oversold levels, reflecting ongoing selling pressure.
Considering the above, a scenario of further downward movement along the lower boundary of the red channel seems plausible. If this develops, the price may fall to the lower boundary of the blue channel, which could serve as a key support level.
This article represents the opinion of the Companies operating under the FXOpen brand only. It is not to be construed as an offer, solicitation, or recommendation with respect to products and services provided by the Companies operating under the FXOpen brand, nor is it to be considered financial advice.

Nasdaq 100 Chart Analysis After the Fed DecisionNasdaq 100 Chart Analysis After the Fed Decision
The Nasdaq 100 index showed sharp volatility yesterday following the interest rate announcement. The market action can be interpreted as follows:
→ First, the FOMC decision was released: as expected, the Federal Funds Rate was cut from 4.00% to 3.75% (a bullish catalyst), which pushed the index up towards point A.
→ However, half an hour later Jerome Powell’s press conference began, and his tone was noticeably hawkish (a bearish catalyst). The Fed Chair signalled that the rate-cutting cycle has been paused because inflation remains elevated and additional labour-market data is needed. As a result, the index fell sharply from point A to the low at point B.
Meanwhile, Donald Trump criticised the Fed’s decision, arguing that rates should be cut far more aggressively. This adds to uncertainty, especially given expectations that Powell will leave his post in May 2026.
Bearish pressure on the tech index intensified further after Oracle’s earnings release — see yesterday’s post for details. The results disappointed investors, fuelling renewed talk of an AI bubble, and ORCL shares plunged around 11% in after-hours trading.
Technical Analysis of the Nasdaq 100 Chart
Looking at recent price action in the Nasdaq 100, the index appears to be forming a bearish Rounding Top pattern:
→ The peak at point A resembles a bull trap, as the price only slightly exceeded the December highs before reversing — in SMC terms, a sign of a bearish liquidity grab.
→ The price then broke support from several recent sessions around 25,570 after forming a large bearish candle (marked by the arrow). This indicates strong selling pressure (a market imbalance) and the area may now act as resistance.
It is possible that bulls will attempt to recover some of yesterday’s losses today. However, if any rebound stalls near this resistance zone, the Nasdaq 100 may continue to drift lower along a rounding downward trajectory.
This article represents the opinion of the Companies operating under the FXOpen brand only. It is not to be construed as an offer, solicitation, or recommendation with respect to products and services provided by the Companies operating under the FXOpen brand, nor is it to be considered financial advice.

Market Analysis: USD/JPY Extends Sharp UpsideMarket Analysis: USD/JPY Extends Sharp Upside
USD/JPY managed to reclaim 156.00 and might aim for more gains.
Important Takeaways for USD/JPY Analysis Today
- USD/JPY climbed higher above 155.50 and 156.00.
- There is a bullish trend line forming with support near 156.30 on the hourly chart.
USD/JPY Technical Analysis
On the hourly chart of USD/JPY, the pair started a decent increase from 154.35. The US Dollar gained bullish momentum above 155.00 against the Japanese Yen.
It settled above the 50-hour simple moving average and 156.00. The upward move was such that the pair even tested 156.90. A high was formed at 156.93 and the pair is now consolidating gains. There was a minor pullback below 156.75.
The current price action is positive, and the pair seems to be aiming for more gains. There is also a bullish trend line forming with support near 156.30 and the 23.6% Fib retracement level of the upward move from the 154.34 swing low to the 156.93 high.
Immediate resistance on the USD/JPY chart is near 156.90. The first key hurdle sits at 157.00. If there is a close above 157.00 and the RSI moves above 60, the pair could rise toward 157.50. The next stop for the bulls might be 157.80, above which the pair could test 158.40 in the coming days.
On the downside, the first major support is near the trend line at 156.30. The next area of interest could be near 155.65, below which the pair could test the 61.8% Fib retracement at 155.35. Any more losses could open the doors for a move toward 154.35.
This article represents the opinion of the Companies operating under the FXOpen brand only. It is not to be construed as an offer, solicitation, or recommendation with respect to products and services provided by the Companies operating under the FXOpen brand, nor is it to be considered financial advice.

Market Analysis: EUR/USD Stalls at ResistanceMarket Analysis: EUR/USD Stalls at Resistance
EUR/USD climbed higher and tested the 1.1680 resistance.
Important Takeaways for EUR/USD Analysis Today
- The Euro started a downside correction from the 1.1680 pivot zone.
- There is a key declining channel forming with resistance at 1.1640 on the hourly chart of EUR/USD.
EUR/USD Technical Analysis
On the hourly chart of EUR/USD, the pair started a fresh increase from 1.1550. The Euro cleared a few key hurdles near 1.1600 to move into a positive zone against the US Dollar.
The pair settled above 1.1600 and the 50-hour simple moving average. A high was formed at 1.1681, and the pair started a downside correction. There was a drop below 1.1650, and the pair tested the 50% Fib retracement level of the upward move from the 1.1555 swing low to the 1.1681 high.
However, the bulls are active above 1.1620. On the upside, the pair is now facing bears near 1.1640 and 1.1650. There is also a key declining channel forming with resistance at 1.1640.
The next breakout region sits at 1.1680. An upside break above 1.1680 could set the pace for another increase. In the stated case, the pair might rise toward 1.1750. Immediate support is 1.1620. The first major key area of interest on the EUR/USD chart is near the 76.4% Fib retracement at 1.1585.
If there is a downside break below 1.1585, the pair could drop toward 1.1555. The next key breakdown area sits at 1.1520, below which the pair could start a major decline.
This article represents the opinion of the Companies operating under the FXOpen brand only. It is not to be construed as an offer, solicitation, or recommendation with respect to products and services provided by the Companies operating under the FXOpen brand, nor is it to be considered financial advice.

Oracle (ORCL) Share Price Rebounds Ahead of Earnings ReleaseOracle (ORCL) Share Price Rebounds Ahead of Earnings Release
Oracle is due to publish its quarterly results today after the close of the main trading session. Analysts are expecting solid year-on-year growth compared with the same period last year:
→ Revenue: forecast to rise by around 15% to $16.15–16.2 billion.
→ Earnings per share (EPS): expected at $1.63–1.65, up roughly 11%.
At the same time, the market’s focus will be on the company’s plans in two key areas:
→ Order backlog growth: investors are looking for confirmation that demand for AI infrastructure remains strong. Previously, orders exceeded $500 billion.
→ Debt and capital expenditure (capex): Oracle is spending aggressively on data centres (capex could rise to as much as $25 billion per year) while taking on additional debt. This has raised concerns that costs may be increasing faster than the actual profits generated from AI.
Today’s results are particularly important in light of the market reaction to the previous earnings release.
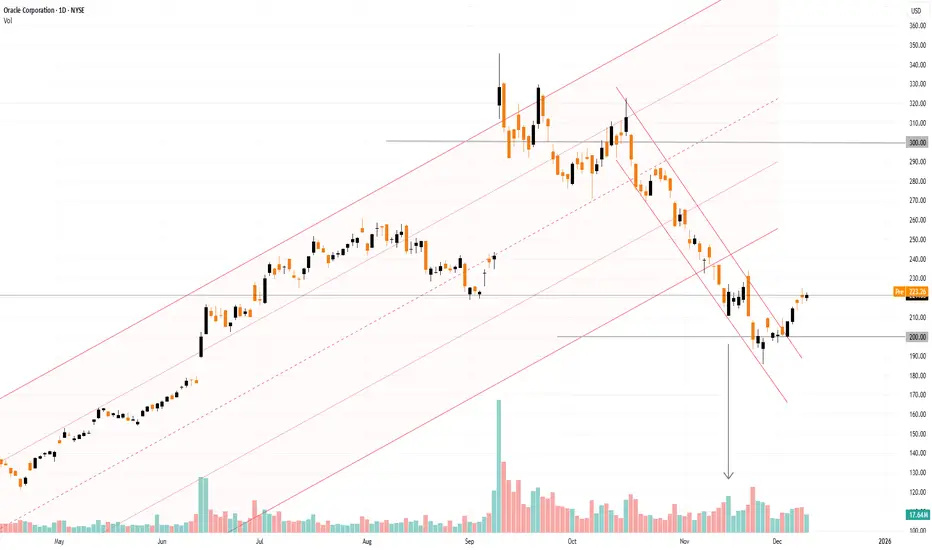
On 15 September, we noted that ORCL shares surged with a bullish gap above the psychological $300 level. Since then, however, the share price has fallen by more than 30%. One possible explanation is that “smart money” used the spike in speculative demand to lock in profits on long positions — a view supported by exceptionally high trading volumes. Once demand faded, the price moved lower within a descending channel.
Within the broader long-term channel (shown in orange), the price briefly broke below the lower boundary but failed to follow through. Meanwhile, the narrowing candle body on 21 November (marked by the arrow), combined with a spike in volume, may suggest that institutional investors were absorbing selling pressure, potentially signalling expectations of higher prices ahead.
Positive signs include:
→ a false bearish break below the psychological $200 level;
→ a break of the red downward trajectory;
→ a rise in ORCL shares in pre-market trading today.
If Oracle’s actual results and management’s outlook impress investors, the ORCL share price could move back into the orange ascending channel.
This article represents the opinion of the Companies operating under the FXOpen brand only. It is not to be construed as an offer, solicitation, or recommendation with respect to products and services provided by the Companies operating under the FXOpen brand, nor is it to be considered financial advice.
S&P 500 Index: Chart Analysis Ahead of Fed NewsS&P 500 Index: Chart Analysis Ahead of Fed News
On 2 December, we noted that the final month of the year is traditionally favourable for the S&P 500 index, as:
→ since around the 1950s, December has been positive in more than 70% of cases;
→ the average monthly gain is approximately +1.0%.
Today, with traders worldwide focused on the Federal Reserve’s interest rate decision and Chair Powell’s subsequent press conference, there is reason to highlight another statistic. According to media reports, in 20 out of 20 instances when equity markets were near record highs and the Fed cut rates, the S&P 500 rose over the following 12 months.
Given the current backdrop — proximity to all-time highs and expectations of rate cuts — it is possible that this could become the 21st such case.
An analysis of price action on the 4-hour chart of the S&P 500 suggests that the stock market is reflecting nervous anticipation of the news, as the index is trading at roughly the same levels as at the start of December.
Technical Analysis of the S&P 500 Chart
From the demand side:
→ the price has managed to hold firmly above the 6785 level (which may act as support going forward) and has broken above a previously formed descending channel (shown in red);
→ an ascending channel formed in early December, which can be interpreted as cautious optimism ahead of the news.
From the supply side:
→ the late-October record high may act as psychological resistance;
→ yesterday’s decline (indicated by the arrow) suggests that bears are ready to act more aggressively if given a catalyst.
Overall, taking the above into account, it is reasonable to suggest that the S&P 500 market is in a “calm before the storm” phase. Be prepared for volatility spikes later today, starting from 22:00 GMT+3.
This article represents the opinion of the Companies operating under the FXOpen brand only. It is not to be construed as an offer, solicitation, or recommendation with respect to products and services provided by the Companies operating under the FXOpen brand, nor is it to be considered financial advice.

Broadcom (AVGO) Shares Hit a Record Ahead of EarningsBroadcom (AVGO) Shares Hit a Record Ahead of Earnings
Broadcom (AVGO) shares reached an all-time high ahead of the company’s quarterly results, due this Thursday, supported by strong fundamental drivers:
→ Partnership with Microsoft: Media reports suggest Broadcom is in talks with Microsoft to develop custom AI chips.
→ Analyst optimism: UBS called Broadcom a “top investment” in the AI sector, citing explosive demand for hardware, and raised its price target to $472.
→ Shift in strategy: Market participants believe the company is refocusing on its own chips to win AI hardware market share from Nvidia.
We highlighted additional bullish drivers in our 14 October analysis.
Technical Analysis of AVGO Shares
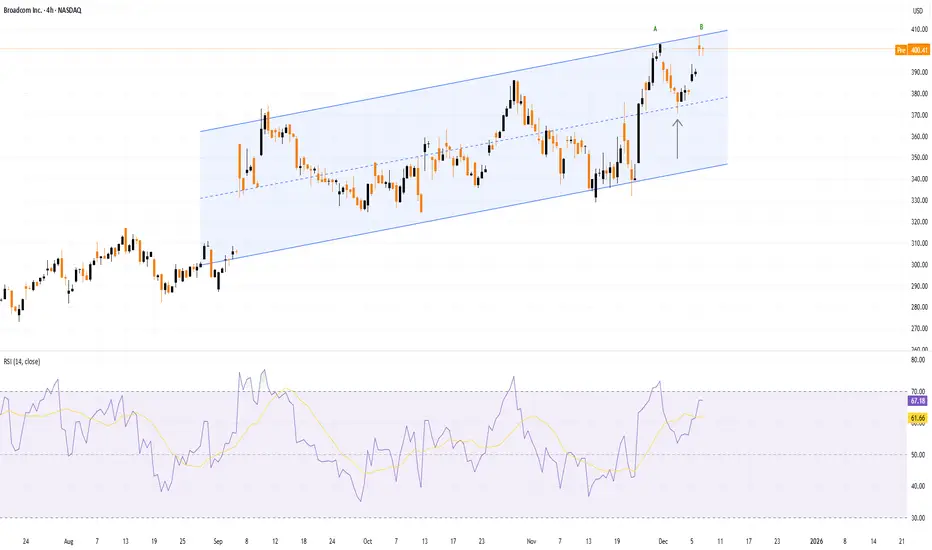
Following a bullish gap on 4 September, price movements have formed an upward channel (shown in blue).
From a bullish perspective:
→ the channel median is acting as support (indicated by the arrow);
→ the wide bullish candle on 24 November signals strong buying pressure;
→ the share is outperforming equity indices.
From a bearish perspective:
→ the AVGO share price is currently near the upper boundary of the channel;
→ the psychological $400 level is showing signs of resistance;
→ at peak B the price rose only slightly above the previous peak A before pulling back – a sign of a potential bull trap.
It is possible that in the coming days, AVGO may show signs of consolidation near the upper channel boundary, while the earnings release could trigger a volatility spike and a large gap, given the market’s elevated expectations.
This article represents the opinion of the Companies operating under the FXOpen brand only. It is not to be construed as an offer, solicitation, or recommendation with respect to products and services provided by the Companies operating under the FXOpen brand, nor is it to be considered financial advice.
USD/CAD Recovers From a 2.5-Month LowUSD/CAD Recovers From a 2.5-Month Low
The main driver of the decline was a sharp shift in sentiment and diverging expectations for policy actions in the United States and Canada.
→ Canada: Friday’s employment data came in far stronger than forecast. As a result, traders sharply reduced the likelihood of a Bank of Canada rate cut at the next meeting, judging the economy resilient enough to pause its easing cycle.
→ United States: Markets are pricing in a high probability of a Federal Reserve rate cut at tomorrow’s meeting (22:00 GMT+3).
This contrast pushed USD/CAD to a 2.5-month low. However, the chart shows that the bulls may still have some grounds for optimism.
USD/CAD Technical Analysis
On 1 December we analysed the USD/CAD chart and:
→ drew an ascending channel (shown in blue) and noted several bearish signals;
→ suggested that the 1.4000 level would act as resistance in the near term, with bears likely to attempt to resume the downward move in USD/CAD.
Indeed, as the arrow indicates, the bears managed to restart the downtrend, which led to:
→ a breakout below the lower boundary of the channel;
→ the need to map out a descending trajectory (shown in red), with its median potentially acting as resistance going forward.
In this context, it is reasonable to assume that the bulls have some cause for hope in the short term, as:
→ the price is rebounding from the lower boundary of the red channel, indicating demand;
→ the RSI has risen from extreme oversold levels;
→ the candle highlighted by the second arrow looks bullish – it closed near the top of its range, forming a long lower shadow.
Given the above, traders should not rule out a corrective recovery in USD/CAD until the Federal Reserve releases its decision, which could significantly impact financial markets.
This article represents the opinion of the Companies operating under the FXOpen brand only. It is not to be construed as an offer, solicitation, or recommendation with respect to products and services provided by the Companies operating under the FXOpen brand, nor is it to be considered financial advice.

Dollar Index Has Fallen to Its Lowest Level in Almost 1.5 MonthsThe Dollar Index Has Fallen to Its Lowest Level in Almost 1.5 Months
The key event of the week will take place on 10 December – at 22:00 GMT+3 the FOMC will publish its interest rate decision, followed half an hour later by a press conference with Jerome Powell.
As the chart of the dollar index (DXY) shows, the US dollar is weakening as the event approaches, reflecting market sentiment – the rate is expected to be cut by 25 basis points due to pressure from Trump and a cooling labour market. This underpins the bearish trend that has been in place since late November.
A reminder that on 24 November we:
→ highlighted the importance of resistance around 100.20 points;
→ and constructed a system of two trend channels.
Since then, the price has moved lower within the descending channel, and:
→ new swing points have allowed us to refine the channel boundaries;
→ a large bearish double-top pattern (A–B) has formed on the chart above the psychological level of 100 points.
The dollar index chart indicates that selling pressure is dominant (as shown by the arrows):
→ the lower boundary of the ascending channel has switched its role from support to resistance;
→ a similar role reversal has occurred at the 99.11 level.
Today, the DXY index is near the lower boundary of the descending channel. It is reasonable to assume that in the short term:
→ the market will enter a wait-and-see mode ahead of the news;
→ a consolidation zone may form on the chart, supported by the lower boundary of the red channel.
Be prepared for surges in volatility on the currency markets on Wednesday evening.
This article represents the opinion of the Companies operating under the FXOpen brand only. It is not to be construed as an offer, solicitation, or recommendation with respect to products and services provided by the Companies operating under the FXOpen brand, nor is it to be considered financial advice.

Netflix to Acquire Warner Bros: Effect on NFLX SharesNetflix to Acquire Warner Bros: Effect on NFLX Shares
A major development in the stock market is the news that Netflix is buying the assets of Warner Bros. Discovery for $82.7 billion. How might this influence the price of NFLX shares?
To assess the outlook, context is essential.
In the second half of October, a bearish gap appeared on the NFLX chart following a disappointing earnings report. On 24 October, we noted that the price might find support near the lower boundary of the established trend channel. Indeed, the price staged a modest recovery (as shown by arrow 1), but the upper edge of the gap acted as resistance.
In mid-November, Netflix (NFLX) carried out a stock split – traditionally viewed as a bullish signal for retail investors. Splits typically make shares more affordable and often lift prices on expectations of fresh liquidity. However, the share price moved lower instead (as indicated by arrow 2).
As a result:
→ the ascending channel was extended downwards, giving greater prominence to the downward trajectory (marked in red);
→ Netflix shares continued to underperform the broader equity market.
Against this backdrop, the mega-deal to acquire Warner Bros. may raise serious concerns for NFLX shareholders:
→ Dilution effect. To finance the deal, Netflix will issue new shares, which dilutes earnings per share (EPS). Existing shareholders effectively receive a smaller portion of the company’s profits.
→ Financial strain. The vast cost of the acquisition worsens Netflix’s financial metrics, increases debt-servicing expenses, and reduces the overall attractiveness of NFLX shares.
→ Regulatory scrutiny. A Netflix–Warner Bros. merger creates a giant controlling nearly half of the streaming market. President Trump has already suggested it could raise antitrust issues.
Given the above, it is reasonable to assume that rising risks and uncertainty may continue to weigh on Netflix shares – and although the psychological $100 level may act as support, traders should not rule out the possibility that NFLX will continue to move within the downward channel.
This article represents the opinion of the Companies operating under the FXOpen brand only. It is not to be construed as an offer, solicitation, or recommendation with respect to products and services provided by the Companies operating under the FXOpen brand, nor is it to be considered financial advice.

Market Analysis: Oil Price Gains TractionMarket Analysis: Oil Price Gains Traction
Crude oil price is recovering and it could climb further higher toward $62.00.
Important Takeaways for Oil Price Analysis Today
- Crude oil prices are moving higher above the $59.00 resistance zone.
- There is a connecting bullish trend line forming with support at $59.40 on the hourly chart of XTI/USD.
Oil Price Technical Analysis
On the hourly chart of WTI Crude Oil, the price started a decent increase against the US Dollar. The price gained bullish momentum after it settled above $58.20.
The bulls pushed the price above the 50-hour simple moving average, and the RSI climbed toward 70. The price tested the $60.20 zone and is currently consolidating gains. There was a minor pullback below $60.00, and the price tested the 23.6% Fib retracement level of the upward move from the $58.20 swing low to the $60.20 low.
Immediate resistance is near $60.20. If the price climbs further higher, it could face bears near $60.50. The next key area of interest might be $61.20. Any more gains might send the price toward $62.00.
Conversely, the price might correct gains and test $59.40. There is also a connecting bullish trend line forming with support at $59.40 and the 50-hour simple moving average.
The main bid area on the WTI crude oil chart could be $59.00 and the 61.8% Fib retracement. If there is a downside break, the price might decline toward $58.20. Any more losses may perhaps open the doors for a move to $57.20.
This article represents the opinion of the Companies operating under the FXOpen brand only. It is not to be construed as an offer, solicitation, or recommendation with respect to products and services provided by the Companies operating under the FXOpen brand, nor is it to be considered financial advice.

Market Analysis: Gold Price Retreats ModestlyMarket Analysis: Gold Price Retreats Modestly
Gold price rallied above $4,250 before correcting lower.
Important Takeaways for Gold Price Analysis Today
- Gold price gained pace for a move above $4,250 and recently corrected lower against the US Dollar.
- A key bullish trend line is forming with support at $4,195 on the hourly chart of gold.
Gold Price Technical Analysis
On the hourly chart of Gold, the price was able to climb above $4,120, as mentioned in the previous analysis. The price even surpassed $4,250 before the bears appeared.
The price traded close to $4,260 before there was a downside correction. There was a move below $4,240 and $4,220. The price settled below the 50-hour simple moving average, and RSI dipped below 50. There was a move below the 50% Fib retracement level of the upward move from the $4,175 swing low to the $4,260 high.
However, the bulls are active above $4,200. There is also a key bullish trend line forming with support at $4,195 and the 76.4% Fib retracement.
Immediate resistance on the upside is $4,240. The next major resistance is $4,260. An upside break above $4,260 could send Gold price toward $4,275. Any more gains may perhaps set the pace for an increase toward $4,290.
If there is no fresh increase, the price could continue to move down. Initial support on the downside is near $4,195 and the trend line. The first key breakdown zone could be $4,175. If there is a downside break below $4,175, the price might decline further. In the stated case, the price might drop to $4,120.
This article represents the opinion of the Companies operating under the FXOpen brand only. It is not to be construed as an offer, solicitation, or recommendation with respect to products and services provided by the Companies operating under the FXOpen brand, nor is it to be considered financial advice.

Gold Price Analysis: Market Awaits Key UpdatesGold Price Analysis: Market Awaits Key Updates
The ADX indicator on the 4-hour XAU/USD chart has dropped to a multi-month low, signalling the absence of a clear trend.
At the same time, a technical assessment of price movements allows for the construction of a symmetrical triangle pattern with a central axis around $4,205 — indicating that the current price reflects an equal balance of major drivers, including:
→ Weakening conditions in the US labour market. According to media reports, ADP recorded an unexpected decline of 32,000 private-sector jobs, while Challenger reported 71,000 layoffs in November, bringing the total number of job cuts since the start of the year close to 1.17 million.
→ Rumours that White House economic adviser Kevin Hassett may replace Federal Reserve Chair Jerome Powell in May — a development that has strengthened expectations of more aggressive policy easing in 2026.
It is worth noting that on 1 December, gold briefly rose above the November high — a move that coincided with silver reaching an all-time record (as suggested in our analysis on 27 November). However, the bulls failed to hold the price above $4,245, indicating a lack of sufficient buying interest. It appears that traders require stronger justification to purchase gold at such elevated levels.
Most likely, market participants have adopted a wait-and-see stance ahead of key releases:
→ Personal Consumption Expenditure (PCE) data for September, whose publication was delayed by the shutdown;
→ Next week’s FOMC decision (10 December).
Although the market currently appears balanced, XAU/USD may be functioning like a “compressed spring”. Be prepared for bursts of volatility.
This article represents the opinion of the Companies operating under the FXOpen brand only. It is not to be construed as an offer, solicitation, or recommendation with respect to products and services provided by the Companies operating under the FXOpen brand, nor is it to be considered financial advice.

NIO Shares Drop Below $5NIO Shares Drop Below $5
As the chart shows, the share price of NIO Inc. (NIO), the Chinese manufacturer of “smart” electric vehicles, has fallen by roughly 30% over the past month and this week slipped below $5 for the first time since mid-August.
Among the bearish drivers:
→ the latest quarterly report revealed gross revenue below analysts’ expectations ($3.06bn versus $3.11bn);
→ a cautious outlook for vehicle deliveries in the upcoming quarter.
Market sentiment appears to have turned wary, given that:
→ the Chinese economy continues to show signs of slowing despite government stimulus;
→ NIO’s revenue prospects may remain constrained by intense competition from BYD, XPeng and Li Auto — a particularly concerning factor as NIO launches new models and sub-brands.
Even so, the NIO share chart does offer some glimmers of optimism.
Technical Analysis of NIO Shares
Using the higher highs and higher lows of 2025, it is possible to outline an ascending channel (shown in blue). Within this structure:
→ the price is hovering near the lower boundary of the channel, which may act as support;
→ the RSI indicator is displaying a bullish divergence.
Another encouraging signal lies in the recent price action: yesterday’s session opened with a bullish gap and ended higher, suggesting renewed buying interest emerging near the psychologically important $5 level.
It is therefore plausible that the bulls may attempt to keep NIO shares within the channel and even resume the upward trend. Whether they succeed, however, will depend largely on sales performance — and on forecasts for 2026 — for the company’s new sub-brands, ONVO and Firefly.
This article represents the opinion of the Companies operating under the FXOpen brand only. It is not to be construed as an offer, solicitation, or recommendation with respect to products and services provided by the Companies operating under the FXOpen brand, nor is it to be considered financial advice.

EUR/USD Pair Reaches 1.5-Month HighEUR/USD Pair Reaches 1.5-Month High
This morning, the EUR/USD rate moved above 1.1680 during early trading — its highest level since mid-October. The main driver behind the rise is traders’ assessment of the diverging policies of central banks. Based on the fundamental outlook ahead of the December meetings:
→ The market is almost certain that the Federal Reserve will cut rates in December under pressure from the Trump administration, making the dollar appear less profitable and less attractive.
→ The ECB, by contrast, has adopted a wait-and-see stance. Inflation in the Eurozone is close to target, and there seems to be no intention to cut rates aggressively for now.
Technical Analysis of the EUR/USD Chart
In November, the pair formed a broad balance zone:
→ The 1.1500 level acted as support — the price dipped below it twice, but failed to hold beneath this psychological mark.
→ A downward sloping trendline (shown in red) served as resistance.
At the start of December, we see that price growth within the blue ascending channel has led to a bullish breakout above the red resistance line.
However, the chart suggests that the rally may now be losing momentum, because:
→ As the arrow indicates, this morning’s attempt to surpass yesterday’s high may result in a candle with a long upper wick.
→ RSI conditions point to a possible bearish divergence between price highs A and B.
It is possible that the EUR/USD rise to a 1.5-month high could attract sellers — therefore, forex traders should not rule out a pullback towards the lower boundary of the blue channel. A retest from above of the red line is also possible.
This article represents the opinion of the Companies operating under the FXOpen brand only. It is not to be construed as an offer, solicitation, or recommendation with respect to products and services provided by the Companies operating under the FXOpen brand, nor is it to be considered financial advice.
