1000BONK/USDT Overview (1D Chart)
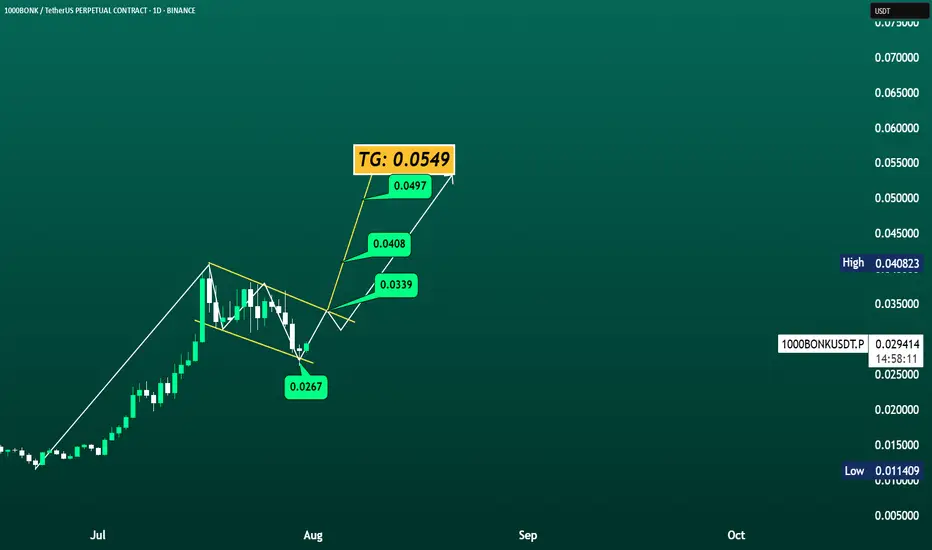
1000BONK has completed a falling wedge breakout from the 0.0267 low and is showing bullish momentum. Key resistance levels to watch are:
📌 0.0339
📌 0.0408
📌 0.0497
🎯 Target: 0.054
1000BONK has completed a falling wedge breakout from the 0.0267 low and is showing bullish momentum. Key resistance levels to watch are:
📌 0.0339
📌 0.0408
📌 0.0497
🎯 Target: 0.054
Disclaimer
The information and publications are not meant to be, and do not constitute, financial, investment, trading, or other types of advice or recommendations supplied or endorsed by TradingView. Read more in the Terms of Use.
Disclaimer
The information and publications are not meant to be, and do not constitute, financial, investment, trading, or other types of advice or recommendations supplied or endorsed by TradingView. Read more in the Terms of Use.