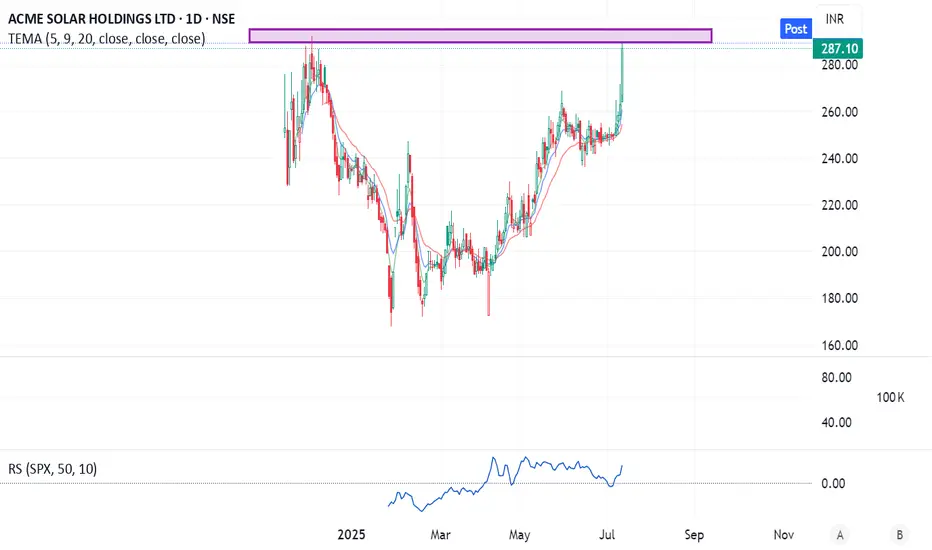
Technical Analysis (Daily Chart)
CMP: ₹287 approx
Pattern: Approaching major resistance zone at ₹290–295 (prior highs). Watch for a breakout or rejection.
EMA 5‑9‑20 Setup: EMAs are stacked bullish and trending upward, showing improved momentum.
Trade Entry: Wait for a decisive close above ₹295 (breakout confirmation).
Stop-Loss: Place below the breakout zone—daily close under ₹282.
Target Zones:
🎯 Target 1: ₹320 (next swing high)
🎯 Target 2: ₹360+ (momentum continuation zone)
🏭 Fundamental Snapshot
Metric Value
Market Cap ~₹17,000 Cr
P/E (TTM) ~60×
P/B Ratio ~3.3×
ROE (TTM) ~9.7%
ROCE ~7.5–7.8%
Dividend Yield ~0.1%
Debt to Equity ~2.3×
Altman Z‑Score ~1.1 (suggests financial stress)
Free Cash Flow Negative (investing-heavy)
Business Highlights:
One of India’s top 10 renewable IPPs with 1.8 GW operational capacity and 3.25 GW under construction.
Strong pipeline with big wins such as battery storage orders & FDRE (firm/dispatchable renewables) projects.
Recent growth: Revenue ~₹15,750 Cr (+19% YoY), Net Profit ₹2,520 Cr.
Backing industry push into energy storage—recent 3.1 GWh BESS order supports diversification.
Key Risks:
High leverage (Debt/Equity >2×), low Altman Z‑score indicates stress.
Negative free cash flow due to capex into expansion.
Valuation steep: P/E ~60×, limited dividend yield.
Disclaimer
The information and publications are not meant to be, and do not constitute, financial, investment, trading, or other types of advice or recommendations supplied or endorsed by TradingView. Read more in the Terms of Use.
Disclaimer
The information and publications are not meant to be, and do not constitute, financial, investment, trading, or other types of advice or recommendations supplied or endorsed by TradingView. Read more in the Terms of Use.