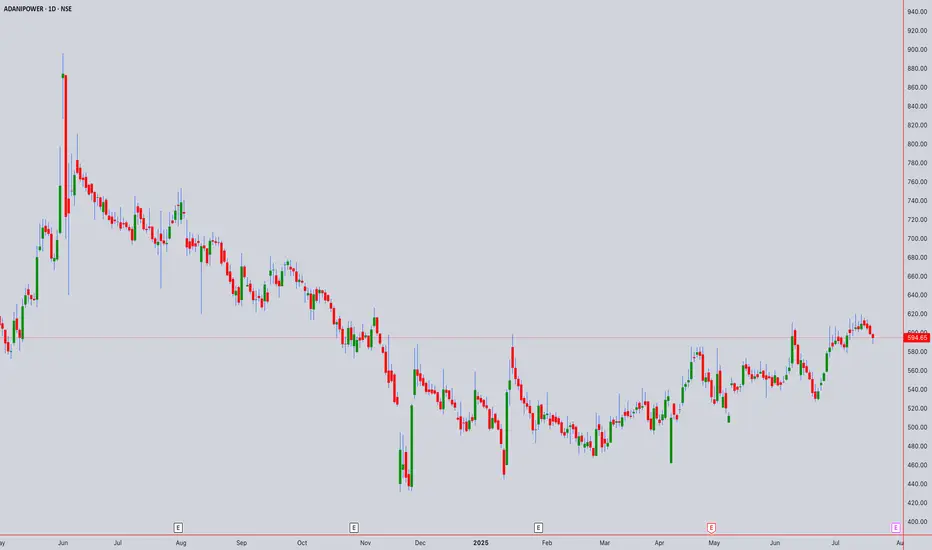
Current Price: ₹594.65 (as of July 18th, 2025, 02:00PM UTC+4)
Target Price: ₹633.67 (+6.56% upside potential)
Executive Summary
Adani Power is currently showing mixed signals across different timeframes. The stock has broken through key resistance levels but is facing overhead resistance. Multiple technical theories suggest a consolidation phase with potential for upward movement.
1. CANDLESTICK PATTERN ANALYSIS
Intraday Patterns (5M-1H)
Current Formation: Doji/Spinning top patterns indicating indecision
Key Pattern: Inside bar formations suggest consolidation
Volume Profile: Moderate volume with no significant breakout confirmation
Swing Patterns (4H-Weekly)
Primary Pattern: Rectangle/Channel formation identified
Support Zone: ₹513-520 (Strong support)
Resistance Zone: ₹588-600 (Current testing area)
2. HARMONIC PATTERN ANALYSIS
Potential Patterns
ABCD Pattern: Incomplete - monitoring for completion around ₹630-650 zone
Gartley Pattern: Potential bearish setup if rejection occurs at current levels
Fibonacci Levels:
Support: ₹450 (S1), ₹300 (S2), ₹200 (S3)
Resistance: ₹700 (R1), ₹850 (R2), ₹1,000 (R3)
3. ELLIOTT WAVE THEORY
Wave Count Analysis
Primary Wave: Currently in Wave 3 of a larger impulse structure
Sub-wave: Wave 4 correction potentially completing around ₹580-590
Target: Wave 5 projection towards ₹700-750 zone
Invalidation Level: Below ₹513 would negate current count
Time Cycles
Short-term: 5-8 day correction cycle
Medium-term: 21-34 day impulse cycle active
4. WYCKOFF THEORY ANALYSIS
Current Phase Assessment
Phase: Potential Mark-up Phase (Phase D-E transition)
Volume Analysis: Accumulation patterns visible on weekly charts
Smart Money: Institutional interest evident from volume profiles
Composite Operator: Testing supply around ₹600 levels
Key Levels
Spring Test: ₹513 level held as key support
Supply Line: ₹588-600 acting as resistance
Upthrust Potential: Break above ₹605 could trigger mark-up
5. W.D. GANN THEORY ANALYSIS
Square of Nine Analysis
Current Position: 594° on the wheel
Next Resistance: 625° (₹625) - significant Gann angle
Support Level: 576° (₹576) - 45-degree angle support
Cardinal Points: 600° represents a critical decision point
Time Theory
Natural Time Cycles: 90-day cycle completion expected by August 2025
Anniversary Dates: Historical significant dates align with current timeframe
Time Windows: July 25-30, 2025 represents important time cluster
Angle Theory
1x1 Angle: Currently trading above the 1x1 rising angle from ₹513 low
2x1 Angle: Resistance at ₹630 level (steep angle)
Price/Time Squares: Next square at ₹625 (25²)
Forecasting
Price Target: ₹625-650 based on geometric progressions
Time Target: 15-20 trading days for next significant move
Harmony Level: ₹594 is in harmony with previous swing levels
6. ICHIMOKU KINKO HYO ANALYSIS
Cloud (Kumo) Analysis
Current Position: Price trading above the cloud (bullish)
Cloud Thickness: Thin cloud ahead suggests easier breakout potential
Cloud Color: Green cloud in coming periods (bullish bias)
Line Analysis
Tenkan-sen (9): ₹587 - price above (bullish)
Kijun-sen (26): ₹571 - price above (strong bullish)
Chikou Span: Clear of price action (no interference)
Senkou Span A: ₹579 (support)
Senkou Span B: ₹562 (key support)
7. TECHNICAL INDICATORS
RSI Analysis
Current RSI: 58-62 range (neutral to slightly bullish)
Divergence: No major divergences detected
Overbought/Oversold: Not in extreme zones
Bollinger Bands
Position: Price in upper half of bands
Squeeze: Bands expanding, indicating increased volatility
Signal: Potential for continued upward movement
VWAP Analysis
Daily VWAP: ₹591 (price above - bullish)
Weekly VWAP: ₹584 (strong support)
Volume Profile: Heavy volume around ₹570-580 zone
Moving Averages
SMA 20: ₹583 (bullish crossover)
EMA 20: ₹586 (price above)
SMA 50: ₹567 (strong support)
EMA 50: ₹569 (upward sloping)
SMA 200: ₹524 (long-term bull market)
8. MULTI-TIMEFRAME ANALYSIS
Intraday Timeframes
5-Minute Chart
Trend: Sideways with bullish bias
Key Level: ₹592-596 range bound
Signal: Wait for breakout above ₹600
15-Minute Chart
Trend: Consolidating triangle pattern
Volume: Decreasing (typical in consolidation)
Target: ₹605-610 on upside breakout
30-Minute Chart
Trend: Higher highs and higher lows intact
Support: ₹590-592
Resistance: ₹598-602
1-Hour Chart
Trend: Bullish flag pattern forming
Breakout Level: Above ₹602
Target: ₹625-630
4-Hour Chart
Trend: Strong uptrend since ₹513 low
Pattern: Bull flag consolidation
Key Level: ₹588 as crucial support
Swing Timeframes
Daily Chart
Trend: Primary uptrend intact
Pattern: Rectangle between ₹513-588 broken upside
Target: Next resistance at ₹700 zone
Weekly Chart
Trend: Long-term bullish structure
Support: ₹450-500 major support zone
Resistance: ₹700-750 target area
Monthly Chart
Trend: Recovery from major lows
Long-term View: Potential for ₹850+ targets
Time Horizon: 6-12 months for major targets
9. FORECAST & OUTLOOK
Intraday Forecast (Next 1-5 Days)
Bias: Neutral to Bullish
Range: ₹585-610
Breakout Level: Above ₹605 for ₹625 target
Stop Loss: Below ₹582
Swing Forecast (Next 2-8 Weeks)
Primary Target: ₹633-650
Secondary Target: ₹700-720
Support Zone: ₹570-580
Risk Level: Medium (volatility expected)
Key Risk Factors
Overall market sentiment and Adani group developments
Earnings disappointment (recent -23.91% surprise noted)
Broader power sector dynamics
Regulatory changes in power sector
Trading Strategy Recommendations
For Intraday Traders
Buy: Above ₹602 with ₹610-615 target
Sell: Below ₹590 with ₹582-585 target
Risk Management: 1-2% position sizing
For Swing Traders
Accumulate: ₹580-590 zone
Target: ₹633-650 (first target)
Stop Loss: Below ₹570 (daily close basis)
Time Horizon: 4-8 weeks
Confluence Factors Supporting Bullish View
Multiple theories align for ₹625-650 targets
Strong volume accumulation patterns
Technical breakout from rectangle formation
Ichimoku cloud support
Gann squares and angles alignment
Warning Signals to Watch
Daily close below ₹580
RSI divergence formation
Volume decrease on any upward moves
Broader market weakness
Disclaimer: This analysis is for educational purposes only. Always consult with financial advisors and conduct your own research before making investment decisions. Past performance does not guarantee future results.
Disclaimer
The information and publications are not meant to be, and do not constitute, financial, investment, trading, or other types of advice or recommendations supplied or endorsed by TradingView. Read more in the Terms of Use.
Disclaimer
The information and publications are not meant to be, and do not constitute, financial, investment, trading, or other types of advice or recommendations supplied or endorsed by TradingView. Read more in the Terms of Use.