ADA has a new weekly candle today. Let's look at the week ahead for ADA based on the charts.
In the past 24 hours, ADA dropped to 1.15. Yesterday, I forecast sideways movement with a possible drop to 1.11 or slightly below, but ADA did not drop that far. Instead, a broad rebound across cryptos pushed ADA back up towards 1.20. ADA, but could not reach the 1.20 resistance level and has instead remained around 1.18.
Looking ahead, this is how the week is shaping up:
Intraday
Summary: Sideways, with possible downturn later in the day towards 1.15
Charts from 90m to 12H show indicators staying around level 50. This means more sideways action in a narrow range around the 1.18 region with a slight upward bias in the first part of the day and downward bias in the second part of the day. Overall, the 24H chart trend is sideways at best, down to 1.11 at worst unless broader crypto market conditions change.
Multi-day (2D to 5D)
Summary: Possible spike to 1.20+, but mostly sideways below 1.20 with increasing chance to drop to 1.11 (1.11 is a fib and current 50-day MA)

The 2D, 3D, and 4D charts all have 2 days remaining. The story is generally similar among them - limited upside (other than a brief spike) and a sideways slow descent.
2D chart shows continued sideways action, but with the LSMA and white EMA below level 50, the B-bands could open up allowing a wider range of prices such as downward to 1.15 or 1.11.
3D chart shows decline in all indicators. The green EMA is at only 52 and the white EMA moved further downward over the last candle to 40. Without a rally, this candle has a chance of closing with the green EMA at/below 50, in which case prices in the next candle would likely drop to the yellow basis at 1.09.
4D chart appears more optimistic with white EMA below 50 at 42, and all others between 69-76. This suggests sideways price action, with B-bands that would allow prices to rally to the 1.25 upper white band on a spike.
Finally, in the 5D (24 hours remain), green EMA is at 55 while white EMA has descended further to 23. With enough downward price action in the next 24 hours, the the green EMA could close at/below 50 in the current 5D candle, making a move in the next candle towards the yellow basis likely (expected to be around 0.83 in the next candle). If it does not close below 50, then the next candle will be the chance to drop below level 50, but will take 5 days to play out. Either way, the risk of a drop to 1.03 or below has continued to increase.
Weekly
Summary: Generally sideways with a slow bleed down to 1.11 and setup for deeper correction to 1.03 or below.
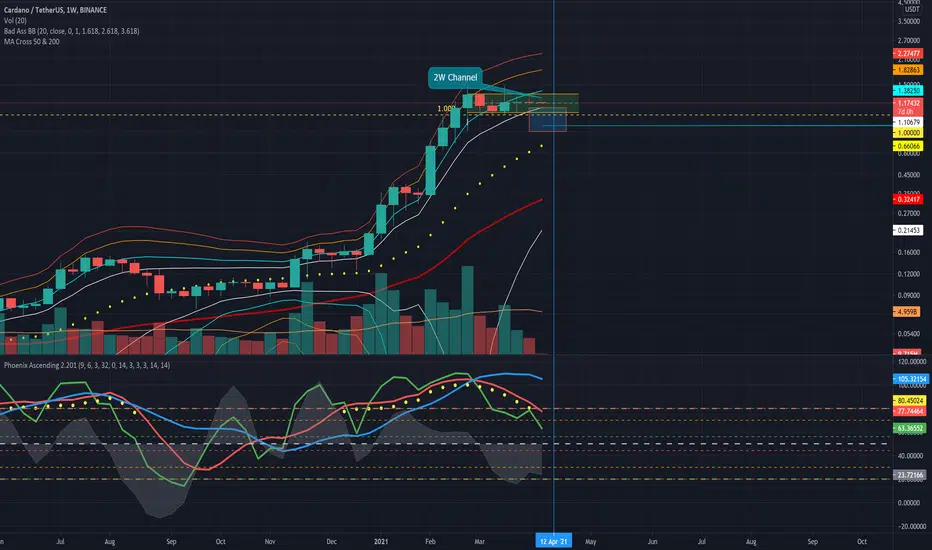
Week over week all indicators dropped with green EMA dropping 14 points and now only 13 points above 50. RSI continues to descend while LSMA is starting to descend. This will narrow the range of price action, limiting highs due to any rally and adding to an overall downward price trend.
Because the trajectory of descent in the trends has not changed in the past week, ADA is still on track to have a breakout downwards from its current channel, particularly later in the week. With the current trajectory, the green EMA in the weekly chart will be very near level 50 or cross below in the next candle (starting April 12). The yellow basis in the current weekly chart is 0.66. Even if the green EMA does not cross level 50 in this week's candle, it suggests continued drop in prices, particularly towards the end of the week. The next candle would raise a significant risk of dropping as low as 0.80 unless there is a reversal.
As always, there are external risks (BTC new ATH, news/events, etc.) that can override TA forecasts, so take this as probabilities, not certainties. Meanwhile be cautious of ADA longs and be patient. Perhaps in another week we may see a big change in this consolidation phase. Until a drop to/below 1.00 is confirmed, anything below 1.11 is in the buy zone. Consider many orders from the 1.11 region down to 0.80 to capture sudden price movements.
Good luck and good fortune!
In the past 24 hours, ADA dropped to 1.15. Yesterday, I forecast sideways movement with a possible drop to 1.11 or slightly below, but ADA did not drop that far. Instead, a broad rebound across cryptos pushed ADA back up towards 1.20. ADA, but could not reach the 1.20 resistance level and has instead remained around 1.18.
Looking ahead, this is how the week is shaping up:
Intraday
Summary: Sideways, with possible downturn later in the day towards 1.15
Charts from 90m to 12H show indicators staying around level 50. This means more sideways action in a narrow range around the 1.18 region with a slight upward bias in the first part of the day and downward bias in the second part of the day. Overall, the 24H chart trend is sideways at best, down to 1.11 at worst unless broader crypto market conditions change.
Multi-day (2D to 5D)
Summary: Possible spike to 1.20+, but mostly sideways below 1.20 with increasing chance to drop to 1.11 (1.11 is a fib and current 50-day MA)
The 2D, 3D, and 4D charts all have 2 days remaining. The story is generally similar among them - limited upside (other than a brief spike) and a sideways slow descent.
2D chart shows continued sideways action, but with the LSMA and white EMA below level 50, the B-bands could open up allowing a wider range of prices such as downward to 1.15 or 1.11.
3D chart shows decline in all indicators. The green EMA is at only 52 and the white EMA moved further downward over the last candle to 40. Without a rally, this candle has a chance of closing with the green EMA at/below 50, in which case prices in the next candle would likely drop to the yellow basis at 1.09.
4D chart appears more optimistic with white EMA below 50 at 42, and all others between 69-76. This suggests sideways price action, with B-bands that would allow prices to rally to the 1.25 upper white band on a spike.
Finally, in the 5D (24 hours remain), green EMA is at 55 while white EMA has descended further to 23. With enough downward price action in the next 24 hours, the the green EMA could close at/below 50 in the current 5D candle, making a move in the next candle towards the yellow basis likely (expected to be around 0.83 in the next candle). If it does not close below 50, then the next candle will be the chance to drop below level 50, but will take 5 days to play out. Either way, the risk of a drop to 1.03 or below has continued to increase.
Weekly
Summary: Generally sideways with a slow bleed down to 1.11 and setup for deeper correction to 1.03 or below.
Week over week all indicators dropped with green EMA dropping 14 points and now only 13 points above 50. RSI continues to descend while LSMA is starting to descend. This will narrow the range of price action, limiting highs due to any rally and adding to an overall downward price trend.
Because the trajectory of descent in the trends has not changed in the past week, ADA is still on track to have a breakout downwards from its current channel, particularly later in the week. With the current trajectory, the green EMA in the weekly chart will be very near level 50 or cross below in the next candle (starting April 12). The yellow basis in the current weekly chart is 0.66. Even if the green EMA does not cross level 50 in this week's candle, it suggests continued drop in prices, particularly towards the end of the week. The next candle would raise a significant risk of dropping as low as 0.80 unless there is a reversal.
As always, there are external risks (BTC new ATH, news/events, etc.) that can override TA forecasts, so take this as probabilities, not certainties. Meanwhile be cautious of ADA longs and be patient. Perhaps in another week we may see a big change in this consolidation phase. Until a drop to/below 1.00 is confirmed, anything below 1.11 is in the buy zone. Consider many orders from the 1.11 region down to 0.80 to capture sudden price movements.
Good luck and good fortune!
Disclaimer
The information and publications are not meant to be, and do not constitute, financial, investment, trading, or other types of advice or recommendations supplied or endorsed by TradingView. Read more in the Terms of Use.
Disclaimer
The information and publications are not meant to be, and do not constitute, financial, investment, trading, or other types of advice or recommendations supplied or endorsed by TradingView. Read more in the Terms of Use.