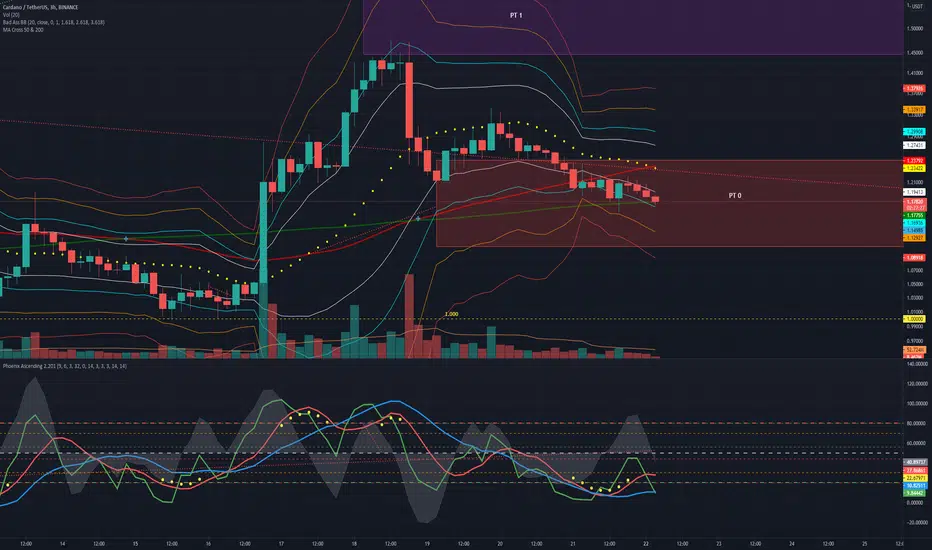
When the 1.44 price target could not be held, we dropped to the PT0 price target area between 1.11 and 1.25. We currently are around the forecast price of 1.17.
Short-term (intraday) - Continuing down, likely to 1.11 fib but mostly sideways
Downward momentum continues to be in control, as seen in the 3H chart. Prices want to stay around the 1.20 region, but downward pressure looks to continue throughout the day, with the 1.11 fib region possible, even if for a short while.
Near-term (1-4 day) - Sideways between 1.11 and 1.20 regions
The 2D chart shows declining green EMA and white EMA, but both are still at upward momentum levels. RSI and LSMA are flat, but both above 50. 3D and 4D are mostly flat in indicators around level 50. This suggests that prices will likely be sideways in the coming week, with a slow bleed down to 1.11, but mostly in the range of 1.11 to 1.20 with wicks a bit above and below.

Mid-term (5 day to 2 week) - Sideways with risk of deeper correction
In the 5 day, RSI and green EMA continue to decline towards 50 indicating fading upward momentum. White EMA is below level 50 and slowing its rise towards 50. The 1 week chart is similar. This suggests mostly sideways price action in the coming week with a bias towards the downside. The 2 week chart (7 days left) shows most indicators topping out and starting downward while the white EMA has moved below level 50. This should keep prices from falling too much in the near term, but the large (and increasing) gap between the oversold green EMA/RSI/LSMA and the white EMA dropping below level 50 poses an increasing risk of a major correction in the first half of April or sooner.

Longer term (Weeks/Months) - Bullish
ADA continues to look quite bullish for the remainder of the year until we hit the peak of this buying cycle.
Short-term (intraday) - Continuing down, likely to 1.11 fib but mostly sideways
Downward momentum continues to be in control, as seen in the 3H chart. Prices want to stay around the 1.20 region, but downward pressure looks to continue throughout the day, with the 1.11 fib region possible, even if for a short while.
Near-term (1-4 day) - Sideways between 1.11 and 1.20 regions
The 2D chart shows declining green EMA and white EMA, but both are still at upward momentum levels. RSI and LSMA are flat, but both above 50. 3D and 4D are mostly flat in indicators around level 50. This suggests that prices will likely be sideways in the coming week, with a slow bleed down to 1.11, but mostly in the range of 1.11 to 1.20 with wicks a bit above and below.
Mid-term (5 day to 2 week) - Sideways with risk of deeper correction
In the 5 day, RSI and green EMA continue to decline towards 50 indicating fading upward momentum. White EMA is below level 50 and slowing its rise towards 50. The 1 week chart is similar. This suggests mostly sideways price action in the coming week with a bias towards the downside. The 2 week chart (7 days left) shows most indicators topping out and starting downward while the white EMA has moved below level 50. This should keep prices from falling too much in the near term, but the large (and increasing) gap between the oversold green EMA/RSI/LSMA and the white EMA dropping below level 50 poses an increasing risk of a major correction in the first half of April or sooner.
Longer term (Weeks/Months) - Bullish
ADA continues to look quite bullish for the remainder of the year until we hit the peak of this buying cycle.
Note
As forecast, ADA has fallen to the 1.11 level (and wicked down to 1.06). Prices are trying to regain the 1.11 fib, but the downward momentum is quite strong. If 1.11 cannot become a strong level of support, we can expect prices to go to the 1.05 region, with a possible wick to 1.00. The next 12H and 1D charts will give us a better idea of whether that is likely to happen.Disclaimer
The information and publications are not meant to be, and do not constitute, financial, investment, trading, or other types of advice or recommendations supplied or endorsed by TradingView. Read more in the Terms of Use.
Disclaimer
The information and publications are not meant to be, and do not constitute, financial, investment, trading, or other types of advice or recommendations supplied or endorsed by TradingView. Read more in the Terms of Use.